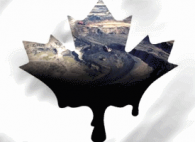
The Tar Deposits of Athabasca Sands
Thar's Black Gold in them thar Sands!
Region: the West Pacific
Quicksearch Query: Athabasca Sands
|
Quicksearch: | |
NS Economy Mobile Home |
Regions Search |
Athabasca Sands NS Page |
|
| GDP Leaders | Export Leaders | Interesting Places BIG Populations | Most Worked | | Militaristic States | Police States | |
Thar's Black Gold in them thar Sands!
Region: the West Pacific
Quicksearch Query: Athabasca Sands
| Athabasca Sands Domestic Statistics | |||
|---|---|---|---|
| Government Category: | Tar Deposits | ||
| Government Priority: | Defence | ||
| Economic Rating: | Frightening | ||
| Civil Rights Rating: | Few | ||
| Political Freedoms: | Below Average | ||
| Income Tax Rate: | 41% | ||
| Consumer Confidence Rate: | 100% | ||
| Worker Enthusiasm Rate: | 101% | ||
| Major Industry: | Arms Manufacturing | ||
| National Animal: | Ghost | ||
| Athabasca Sands Demographics | |||
| Total Population: | 26,448,000,000 | ||
| Criminals: | 2,028,728,978 | ||
| Elderly, Disabled, & Retirees: | 2,956,530,260 | ||
| Military & Reserves: ? | 1,691,468,931 | ||
| Students and Youth: | 5,153,392,800 | ||
| Unemployed but Able: | 3,495,189,397 | ||
| Working Class: | 11,122,689,634 | ||
| Athabasca Sands Government Budget Details | |||
| Government Budget: | $476,156,794,445,286.56 | ||
| Government Expenditures: | $452,348,954,723,022.19 | ||
| Goverment Waste: | $23,807,839,722,264.38 | ||
| Goverment Efficiency: | 95% | ||
| Athabasca Sands Government Spending Breakdown: | |||
| Administration: | $85,946,301,397,374.22 | 19% | |
| Social Welfare: | $18,093,958,188,920.89 | 4% | |
| Healthcare: | $31,664,426,830,611.55 | 7% | |
| Education: | $76,899,322,302,913.78 | 17% | |
| Religion & Spirituality: | $0.00 | 0% | |
| Defense: | $99,516,770,039,064.88 | 22% | |
| Law & Order: | $54,281,874,566,762.66 | 12% | |
| Commerce: | $81,422,811,850,143.98 | 18% | |
| Public Transport: | $0.00 | 0% | |
| The Environment: | $9,046,979,094,460.44 | 2% | |
| Social Equality: | $0.00 | 0% | |
| Athabasca SandsWhite Market Economic Statistics ? | |||
| Gross Domestic Product: | $368,362,000,000,000.00 | ||
| GDP Per Capita: | $13,927.78 | ||
| Average Salary Per Employee: | $21,742.01 | ||
| Unemployment Rate: | 13.48% | ||
| Consumption: | $552,486,558,121,328.62 | ||
| Exports: | $118,407,930,314,752.00 | ||
| Imports: | $125,608,667,381,760.00 | ||
| Trade Net: | -7,200,737,067,008.00 | ||
| Athabasca Sands Non Market Statistics ? Evasion, Black Market, Barter & Crime | |||
| Black & Grey Markets Combined: | $1,191,166,634,653,381.50 | ||
| Avg Annual Criminal's Income / Savings: ? | $50,967.81 | ||
| Recovered Product + Fines & Fees: | $107,204,997,118,804.33 | ||
| Black Market & Non Monetary Trade: | |||
| Guns & Weapons: | $67,964,394,673,417.98 | ||
| Drugs and Pharmaceuticals: | $47,884,005,338,089.95 | ||
| Extortion & Blackmail: | $114,303,754,678,021.16 | ||
| Counterfeit Goods: | $126,660,917,345,915.33 | ||
| Trafficking & Intl Sales: | $3,089,290,666,973.54 | ||
| Theft & Disappearance: | $21,625,034,668,814.81 | ||
| Counterfeit Currency & Instruments : | $129,750,208,012,888.86 | ||
| Illegal Mining, Logging, and Hunting : | $6,178,581,333,947.09 | ||
| Basic Necessitites : | $38,616,133,337,169.30 | ||
| School Loan Fraud : | $55,607,232,005,523.80 | ||
| Tax Evasion + Barter Trade : | $512,201,652,900,954.06 | ||
| Athabasca Sands Total Market Statistics ? | |||
| National Currency: | Tar | ||
| Exchange Rates: | 1 Tar = $1.10 | ||
| $1 = 0.91 Tars | |||
| Regional Exchange Rates | |||
| Gross Domestic Product: | $368,362,000,000,000.00 - 24% | ||
| Black & Grey Markets Combined: | $1,191,166,634,653,381.50 - 76% | ||
| Real Total Economy: | $1,559,528,634,653,381.50 | ||
| the West Pacific Economic Statistics & Links | |||
| Gross Regional Product: | $230,635,723,705,810,944 | ||
| Region Wide Imports: | $29,163,366,958,235,648 | ||
| Largest Regional GDP: | Sindria | ||
| Largest Regional Importer: | R2Cruiter | ||
| Regional Search Functions: | All the West Pacific Nations. | ||
| Regional Nations by GDP | Regional Trading Leaders | |||
| Regional Exchange Rates | WA Members | |||
| Returns to standard Version: | FAQ | About | About | 635,028,243 uses since September 1, 2011. | |
Version 3.69 HTML4. V 0.7 is HTML1. |
Like our Calculator? Tell your friends for us... |