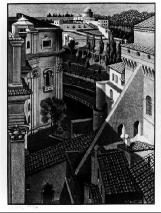
The Republic of Between St Peter and Sistine Chapel
#289
Region: The Works of M C Escher
Quicksearch Query: Between St Peter and Sistine Chapel
|
Quicksearch: | |
NS Economy Mobile Home |
Regions Search |
Between St Peter and Sistine Chapel NS Page |
|
| GDP Leaders | Export Leaders | Interesting Places BIG Populations | Most Worked | | Militaristic States | Police States | |

#289
Region: The Works of M C Escher
Quicksearch Query: Between St Peter and Sistine Chapel
| Between St Peter and Sistine Chapel Domestic Statistics | |||
|---|---|---|---|
| Government Category: | Republic | ||
| Government Priority: | Law & Order | ||
| Economic Rating: | Good | ||
| Civil Rights Rating: | Good | ||
| Political Freedoms: | Good | ||
| Income Tax Rate: | 21% | ||
| Consumer Confidence Rate: | 101% | ||
| Worker Enthusiasm Rate: | 103% | ||
| Major Industry: | Tourism | ||
| National Animal: | cobra | ||
| Between St Peter and Sistine Chapel Demographics | |||
| Total Population: | 1,127,000,000 | ||
| Criminals: | 124,772,072 | ||
| Elderly, Disabled, & Retirees: | 153,171,841 | ||
| Military & Reserves: ? | 43,175,178 | ||
| Students and Youth: | 192,153,500 | ||
| Unemployed but Able: | 177,178,392 | ||
| Working Class: | 436,549,018 | ||
| Between St Peter and Sistine Chapel Government Budget Details | |||
| Government Budget: | $2,844,852,818,836.19 | ||
| Government Expenditures: | $2,731,058,706,082.75 | ||
| Goverment Waste: | $113,794,112,753.45 | ||
| Goverment Efficiency: | 96% | ||
| Between St Peter and Sistine Chapel Government Spending Breakdown: | |||
| Administration: | $273,105,870,608.28 | 10% | |
| Social Welfare: | $300,416,457,669.10 | 11% | |
| Healthcare: | $300,416,457,669.10 | 11% | |
| Education: | $273,105,870,608.28 | 10% | |
| Religion & Spirituality: | $81,931,761,182.48 | 3% | |
| Defense: | $409,658,805,912.41 | 15% | |
| Law & Order: | $409,658,805,912.41 | 15% | |
| Commerce: | $109,242,348,243.31 | 4% | |
| Public Transport: | $273,105,870,608.28 | 10% | |
| The Environment: | $109,242,348,243.31 | 4% | |
| Social Equality: | $136,552,935,304.14 | 5% | |
| Between St Peter and Sistine ChapelWhite Market Economic Statistics ? | |||
| Gross Domestic Product: | $2,351,530,000,000.00 | ||
| GDP Per Capita: | $2,086.54 | ||
| Average Salary Per Employee: | $3,642.42 | ||
| Unemployment Rate: | 23.99% | ||
| Consumption: | $6,951,972,676,567.04 | ||
| Exports: | $1,188,484,820,992.00 | ||
| Imports: | $1,198,415,020,032.00 | ||
| Trade Net: | -9,930,199,040.00 | ||
| Between St Peter and Sistine Chapel Non Market Statistics ? Evasion, Black Market, Barter & Crime | |||
| Black & Grey Markets Combined: | $2,915,937,179,452.36 | ||
| Avg Annual Criminal's Income / Savings: ? | $1,947.51 | ||
| Recovered Product + Fines & Fees: | $328,042,932,688.39 | ||
| Black Market & Non Monetary Trade: | |||
| Guns & Weapons: | $116,164,103,001.62 | ||
| Drugs and Pharmaceuticals: | $129,071,225,557.35 | ||
| Extortion & Blackmail: | $103,256,980,445.88 | ||
| Counterfeit Goods: | $195,450,712,986.85 | ||
| Trafficking & Intl Sales: | $99,569,231,144.24 | ||
| Theft & Disappearance: | $118,007,977,652.44 | ||
| Counterfeit Currency & Instruments : | $239,703,704,606.51 | ||
| Illegal Mining, Logging, and Hunting : | $66,379,487,429.50 | ||
| Basic Necessitites : | $136,446,724,160.63 | ||
| School Loan Fraud : | $88,505,983,239.33 | ||
| Tax Evasion + Barter Trade : | $1,253,852,987,164.52 | ||
| Between St Peter and Sistine Chapel Total Market Statistics ? | |||
| National Currency: | ruble | ||
| Exchange Rates: | 1 ruble = $0.20 | ||
| $1 = 5.08 rubles | |||
| Regional Exchange Rates | |||
| Gross Domestic Product: | $2,351,530,000,000.00 - 45% | ||
| Black & Grey Markets Combined: | $2,915,937,179,452.36 - 55% | ||
| Real Total Economy: | $5,267,467,179,452.36 | ||
| The Works of M C Escher Economic Statistics & Links | |||
| Gross Regional Product: | $8,405,572,583,948,288 | ||
| Region Wide Imports: | $1,135,219,851,657,216 | ||
| Largest Regional GDP: | White Cat I | ||
| Largest Regional Importer: | Sunflowers- | ||
| Regional Search Functions: | All The Works of M C Escher Nations. | ||
| Regional Nations by GDP | Regional Trading Leaders | |||
| Regional Exchange Rates | WA Members | |||
| Returns to standard Version: | FAQ | About | About | 592,384,503 uses since September 1, 2011. | |
Version 3.69 HTML4. V 0.7 is HTML1. |
Like our Calculator? Tell your friends for us... |