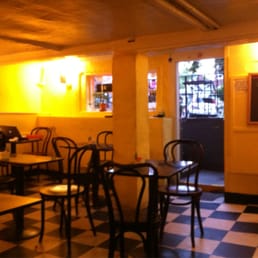
The Democratic Republic of Cafe Pamplona
1959-2020
Region: Ghosts of Harvard Square
Quicksearch Query: Cafe Pamplona
|
Quicksearch: | |
NS Economy Mobile Home |
Regions Search |
Cafe Pamplona NS Page |
|
| GDP Leaders | Export Leaders | Interesting Places BIG Populations | Most Worked | | Militaristic States | Police States | |
1959-2020
Region: Ghosts of Harvard Square
Quicksearch Query: Cafe Pamplona
| Cafe Pamplona Domestic Statistics | |||
|---|---|---|---|
| Government Category: | Democratic Republic | ||
| Government Priority: | Education | ||
| Economic Rating: | Frightening | ||
| Civil Rights Rating: | World Benchmark | ||
| Political Freedoms: | World Benchmark | ||
| Income Tax Rate: | 95% | ||
| Consumer Confidence Rate: | 109% | ||
| Worker Enthusiasm Rate: | 112% | ||
| Major Industry: | Information Technology | ||
| National Animal: | bull | ||
| Cafe Pamplona Demographics | |||
| Total Population: | 12,267,000,000 | ||
| Criminals: | 490,053,095 | ||
| Elderly, Disabled, & Retirees: | 671,073,774 | ||
| Military & Reserves: ? | 39,979,387 | ||
| Students and Youth: | 3,128,085,000 | ||
| Unemployed but Able: | 1,314,556,923 | ||
| Working Class: | 6,623,251,820 | ||
| Cafe Pamplona Government Budget Details | |||
| Government Budget: | $565,961,236,444,914.62 | ||
| Government Expenditures: | $560,301,624,080,465.50 | ||
| Goverment Waste: | $5,659,612,364,449.13 | ||
| Goverment Efficiency: | 99% | ||
| Cafe Pamplona Government Spending Breakdown: | |||
| Administration: | $84,045,243,612,069.83 | 15% | |
| Social Welfare: | $61,633,178,648,851.20 | 11% | |
| Healthcare: | $56,030,162,408,046.55 | 10% | |
| Education: | $112,060,324,816,093.11 | 20% | |
| Religion & Spirituality: | $0.00 | 0% | |
| Defense: | $5,603,016,240,804.66 | 1% | |
| Law & Order: | $33,618,097,444,827.93 | 6% | |
| Commerce: | $50,427,146,167,241.89 | 9% | |
| Public Transport: | $28,015,081,204,023.28 | 5% | |
| The Environment: | $67,236,194,889,655.86 | 12% | |
| Social Equality: | $44,824,129,926,437.24 | 8% | |
| Cafe PamplonaWhite Market Economic Statistics ? | |||
| Gross Domestic Product: | $459,771,000,000,000.00 | ||
| GDP Per Capita: | $37,480.31 | ||
| Average Salary Per Employee: | $55,084.34 | ||
| Unemployment Rate: | 3.00% | ||
| Consumption: | $26,296,136,918,630.40 | ||
| Exports: | $66,671,065,104,384.00 | ||
| Imports: | $67,275,998,625,792.00 | ||
| Trade Net: | -604,933,521,408.00 | ||
| Cafe Pamplona Non Market Statistics ? Evasion, Black Market, Barter & Crime | |||
| Black & Grey Markets Combined: | $758,690,199,623,692.25 | ||
| Avg Annual Criminal's Income / Savings: ? | $104,890.22 | ||
| Recovered Product + Fines & Fees: | $34,141,058,983,066.15 | ||
| Black Market & Non Monetary Trade: | |||
| Guns & Weapons: | $2,064,965,050,825.78 | ||
| Drugs and Pharmaceuticals: | $41,299,301,016,515.69 | ||
| Extortion & Blackmail: | $49,559,161,219,818.82 | ||
| Counterfeit Goods: | $32,006,958,287,799.66 | ||
| Trafficking & Intl Sales: | $22,714,615,559,083.63 | ||
| Theft & Disappearance: | $37,169,370,914,864.12 | ||
| Counterfeit Currency & Instruments : | $44,396,748,592,754.37 | ||
| Illegal Mining, Logging, and Hunting : | $29,941,993,236,973.87 | ||
| Basic Necessitites : | $51,624,126,270,644.61 | ||
| School Loan Fraud : | $53,689,091,321,470.40 | ||
| Tax Evasion + Barter Trade : | $326,236,785,838,187.69 | ||
| Cafe Pamplona Total Market Statistics ? | |||
| National Currency: | dollar | ||
| Exchange Rates: | 1 dollar = $1.80 | ||
| $1 = 0.55 dollars | |||
| Regional Exchange Rates | |||
| Gross Domestic Product: | $459,771,000,000,000.00 - 38% | ||
| Black & Grey Markets Combined: | $758,690,199,623,692.25 - 62% | ||
| Real Total Economy: | $1,218,461,199,623,692.25 | ||
| Ghosts of Harvard Square Economic Statistics & Links | |||
| Gross Regional Product: | $3,652,015,255,191,552 | ||
| Region Wide Imports: | $462,964,859,600,896 | ||
| Largest Regional GDP: | Cafe Pamplona | ||
| Largest Regional Importer: | Cafe Pamplona | ||
| Regional Search Functions: | All Ghosts of Harvard Square Nations. | ||
| Regional Nations by GDP | Regional Trading Leaders | |||
| Regional Exchange Rates | WA Members | |||
| Returns to standard Version: | FAQ | About | About | 678,010,739 uses since September 1, 2011. | |
Version 3.69 HTML4. V 0.7 is HTML1. |
Like our Calculator? Tell your friends for us... |