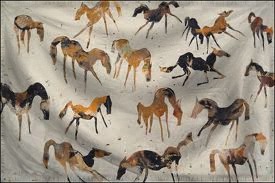
The Tipi of Crazy Horses
Weird, really weird.
Region: Femisphere
Quicksearch Query: Crazy Horses
|
Quicksearch: | |
NS Economy Mobile Home |
Regions Search |
Crazy Horses NS Page |
|
| GDP Leaders | Export Leaders | Interesting Places BIG Populations | Most Worked | | Militaristic States | Police States | |
| Crazy Horses Domestic Statistics | |||
|---|---|---|---|
| Government Category: | Tipi | ||
| Government Priority: | Commerce | ||
| Economic Rating: | Frightening | ||
| Civil Rights Rating: | Average | ||
| Political Freedoms: | Some | ||
| Income Tax Rate: | 42% | ||
| Consumer Confidence Rate: | 104% | ||
| Worker Enthusiasm Rate: | 103% | ||
| Major Industry: | Arms Manufacturing | ||
| National Animal: | horse | ||
| Crazy Horses Demographics | |||
| Total Population: | 28,258,000,000 | ||
| Criminals: | 2,102,581,462 | ||
| Elderly, Disabled, & Retirees: | 3,353,524,363 | ||
| Military & Reserves: ? | 2,656,676,322 | ||
| Students and Youth: | 5,292,723,400 | ||
| Unemployed but Able: | 3,672,314,931 | ||
| Working Class: | 11,180,179,522 | ||
| Crazy Horses Government Budget Details | |||
| Government Budget: | $548,336,596,866,595.62 | ||
| Government Expenditures: | $515,436,401,054,599.88 | ||
| Goverment Waste: | $32,900,195,811,995.75 | ||
| Goverment Efficiency: | 94% | ||
| Crazy Horses Government Spending Breakdown: | |||
| Administration: | $0.00 | 0% | |
| Social Welfare: | $5,154,364,010,546.00 | 1% | |
| Healthcare: | $10,308,728,021,092.00 | 2% | |
| Education: | $67,006,732,137,097.98 | 13% | |
| Religion & Spirituality: | $0.00 | 0% | |
| Defense: | $164,939,648,337,471.97 | 32% | |
| Law & Order: | $77,315,460,158,189.98 | 15% | |
| Commerce: | $170,094,012,348,017.97 | 33% | |
| Public Transport: | $20,617,456,042,184.00 | 4% | |
| The Environment: | $0.00 | 0% | |
| Social Equality: | $0.00 | 0% | |
| Crazy HorsesWhite Market Economic Statistics ? | |||
| Gross Domestic Product: | $429,549,000,000,000.00 | ||
| GDP Per Capita: | $15,200.97 | ||
| Average Salary Per Employee: | $26,751.48 | ||
| Unemployment Rate: | 12.56% | ||
| Consumption: | $615,434,919,513,948.12 | ||
| Exports: | $139,170,803,613,696.00 | ||
| Imports: | $135,926,537,781,248.00 | ||
| Trade Net: | 3,244,265,832,448.00 | ||
| Crazy Horses Non Market Statistics ? Evasion, Black Market, Barter & Crime | |||
| Black & Grey Markets Combined: | $719,466,232,519,988.38 | ||
| Avg Annual Criminal's Income / Savings: ? | $34,355.66 | ||
| Recovered Product + Fines & Fees: | $80,939,951,158,498.69 | ||
| Black Market & Non Monetary Trade: | |||
| Guns & Weapons: | $58,233,596,860,167.86 | ||
| Drugs and Pharmaceuticals: | $15,468,299,165,982.09 | ||
| Extortion & Blackmail: | $60,053,396,762,048.11 | ||
| Counterfeit Goods: | $116,467,193,720,335.72 | ||
| Trafficking & Intl Sales: | $7,279,199,607,520.98 | ||
| Theft & Disappearance: | $3,639,599,803,760.49 | ||
| Counterfeit Currency & Instruments : | $56,413,796,958,287.61 | ||
| Illegal Mining, Logging, and Hunting : | $3,639,599,803,760.49 | ||
| Basic Necessitites : | $13,648,499,264,101.84 | ||
| School Loan Fraud : | $23,657,398,724,443.20 | ||
| Tax Evasion + Barter Trade : | $309,370,479,983,595.00 | ||
| Crazy Horses Total Market Statistics ? | |||
| National Currency: | Dollar | ||
| Exchange Rates: | 1 Dollar = $1.15 | ||
| $1 = 0.87 Dollars | |||
| Regional Exchange Rates | |||
| Gross Domestic Product: | $429,549,000,000,000.00 - 37% | ||
| Black & Grey Markets Combined: | $719,466,232,519,988.38 - 63% | ||
| Real Total Economy: | $1,149,015,232,519,988.50 | ||
| Femisphere Economic Statistics & Links | |||
| Gross Regional Product: | $2,183,272,402,518,016 | ||
| Region Wide Imports: | $286,353,120,034,816 | ||
| Largest Regional GDP: | Queen Aelita | ||
| Largest Regional Importer: | Queen Aelita | ||
| Regional Search Functions: | All Femisphere Nations. | ||
| Regional Nations by GDP | Regional Trading Leaders | |||
| Regional Exchange Rates | WA Members | |||
| Returns to standard Version: | FAQ | About | About | 582,684,528 uses since September 1, 2011. | |
Version 3.69 HTML4. V 0.7 is HTML1. |
Like our Calculator? Tell your friends for us... |