The Nomadic Peoples of East Enders
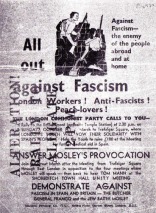
They shall not pass
Region: BUF
Quicksearch Query: East Enders
|
Quicksearch: | |
NS Economy Mobile Home |
Regions Search |
East Enders NS Page |
|
| GDP Leaders | Export Leaders | Interesting Places BIG Populations | Most Worked | | Militaristic States | Police States | |
| East Enders Domestic Statistics | |||
|---|---|---|---|
| Government Category: | Nomadic Peoples | ||
| Government Priority: | Social Welfare | ||
| Economic Rating: | Basket Case | ||
| Civil Rights Rating: | Superb | ||
| Political Freedoms: | World Benchmark | ||
| Income Tax Rate: | 72% | ||
| Consumer Confidence Rate: | 99% | ||
| Worker Enthusiasm Rate: | 102% | ||
| Major Industry: | Retail | ||
| National Animal: | Dog | ||
| East Enders Demographics | |||
| Total Population: | 27,851,000,000 | ||
| Criminals: | 3,164,614,379 | ||
| Elderly, Disabled, & Retirees: | 3,168,654,126 | ||
| Military & Reserves: ? | 485,131,786 | ||
| Students and Youth: | 5,458,796,000 | ||
| Unemployed but Able: | 4,508,178,676 | ||
| Working Class: | 11,065,625,032 | ||
| East Enders Government Budget Details | |||
| Government Budget: | $8,252,197,295,971.37 | ||
| Government Expenditures: | $8,169,675,323,011.65 | ||
| Goverment Waste: | $82,521,972,959.71 | ||
| Goverment Efficiency: | 99% | ||
| East Enders Government Spending Breakdown: | |||
| Administration: | $571,877,272,610.82 | 7% | |
| Social Welfare: | $1,307,148,051,681.86 | 16% | |
| Healthcare: | $816,967,532,301.17 | 10% | |
| Education: | $816,967,532,301.17 | 10% | |
| Religion & Spirituality: | $571,877,272,610.82 | 7% | |
| Defense: | $571,877,272,610.82 | 7% | |
| Law & Order: | $490,180,519,380.70 | 6% | |
| Commerce: | $571,877,272,610.82 | 7% | |
| Public Transport: | $571,877,272,610.82 | 7% | |
| The Environment: | $571,877,272,610.82 | 7% | |
| Social Equality: | $571,877,272,610.82 | 7% | |
| East EndersWhite Market Economic Statistics ? | |||
| Gross Domestic Product: | $6,748,340,000,000.00 | ||
| GDP Per Capita: | $242.30 | ||
| Average Salary Per Employee: | $400.29 | ||
| Unemployment Rate: | 25.94% | ||
| Consumption: | $2,763,712,008,028.16 | ||
| Exports: | $1,380,563,681,280.00 | ||
| Imports: | $1,380,563,681,280.00 | ||
| Trade Net: | 0.00 | ||
| East Enders Non Market Statistics ? Evasion, Black Market, Barter & Crime | |||
| Black & Grey Markets Combined: | $10,788,339,615,427.57 | ||
| Avg Annual Criminal's Income / Savings: ? | $242.81 | ||
| Recovered Product + Fines & Fees: | $485,475,282,694.24 | ||
| Black Market & Non Monetary Trade: | |||
| Guns & Weapons: | $256,927,679,297.54 | ||
| Drugs and Pharmaceuticals: | $543,218,521,943.37 | ||
| Extortion & Blackmail: | $411,084,286,876.06 | ||
| Counterfeit Goods: | $484,492,195,246.79 | ||
| Trafficking & Intl Sales: | $411,084,286,876.06 | ||
| Theft & Disappearance: | $499,173,776,920.93 | ||
| Counterfeit Currency & Instruments : | $484,492,195,246.79 | ||
| Illegal Mining, Logging, and Hunting : | $308,313,215,157.05 | ||
| Basic Necessitites : | $719,397,502,033.11 | ||
| School Loan Fraud : | $396,402,705,201.92 | ||
| Tax Evasion + Barter Trade : | $4,638,986,034,633.85 | ||
| East Enders Total Market Statistics ? | |||
| National Currency: | Quid | ||
| Exchange Rates: | 1 Quid = $0.01 | ||
| $1 = 69.02 Quids | |||
| Regional Exchange Rates | |||
| Gross Domestic Product: | $6,748,340,000,000.00 - 38% | ||
| Black & Grey Markets Combined: | $10,788,339,615,427.57 - 62% | ||
| Real Total Economy: | $17,536,679,615,427.57 | ||
| BUF Economic Statistics & Links | |||
| Gross Regional Product: | $9,870,400,028,672 | ||
| Region Wide Imports: | $1,380,563,681,280 | ||
| Largest Regional GDP: | East Enders | ||
| Largest Regional Importer: | East Enders | ||
| Regional Search Functions: | All BUF Nations. | ||
| Regional Nations by GDP | Regional Trading Leaders | |||
| Regional Exchange Rates | WA Members | |||
| Returns to standard Version: | FAQ | About | About | 636,542,025 uses since September 1, 2011. | |
Version 3.69 HTML4. V 0.7 is HTML1. |
Like our Calculator? Tell your friends for us... |