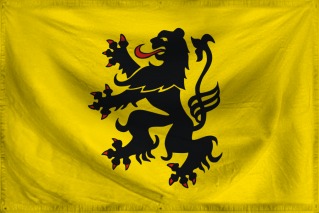
The Federation of Free Flanders
Patience is bitter, but its fruit is sweet.
Region: United opia nations
Quicksearch Query: Free Flanders
|
Quicksearch: | |
NS Economy Mobile Home |
Regions Search |
Free Flanders NS Page |
|
| GDP Leaders | Export Leaders | Interesting Places BIG Populations | Most Worked | | Militaristic States | Police States | |

Patience is bitter, but its fruit is sweet.
Region: United opia nations
Quicksearch Query: Free Flanders
| Free Flanders Domestic Statistics | |||
|---|---|---|---|
| Government Category: | Federation | ||
| Government Priority: | Defence | ||
| Economic Rating: | Good | ||
| Civil Rights Rating: | Good | ||
| Political Freedoms: | Good | ||
| Income Tax Rate: | 20% | ||
| Consumer Confidence Rate: | 101% | ||
| Worker Enthusiasm Rate: | 103% | ||
| Major Industry: | Automobile Manufacturing | ||
| National Animal: | lion | ||
| Free Flanders Demographics | |||
| Total Population: | 22,701,000,000 | ||
| Criminals: | 2,517,608,115 | ||
| Elderly, Disabled, & Retirees: | 3,073,840,205 | ||
| Military & Reserves: ? | 926,944,832 | ||
| Students and Youth: | 3,881,871,000 | ||
| Unemployed but Able: | 3,572,005,343 | ||
| Working Class: | 8,728,730,505 | ||
| Free Flanders Government Budget Details | |||
| Government Budget: | $55,601,799,360,581.47 | ||
| Government Expenditures: | $53,377,727,386,158.21 | ||
| Goverment Waste: | $2,224,071,974,423.26 | ||
| Goverment Efficiency: | 96% | ||
| Free Flanders Government Spending Breakdown: | |||
| Administration: | $5,871,550,012,477.40 | 11% | |
| Social Welfare: | $6,405,327,286,338.99 | 12% | |
| Healthcare: | $6,405,327,286,338.99 | 12% | |
| Education: | $5,871,550,012,477.40 | 11% | |
| Religion & Spirituality: | $1,601,331,821,584.75 | 3% | |
| Defense: | $8,540,436,381,785.31 | 16% | |
| Law & Order: | $5,871,550,012,477.40 | 11% | |
| Commerce: | $2,135,109,095,446.33 | 4% | |
| Public Transport: | $5,871,550,012,477.40 | 11% | |
| The Environment: | $2,135,109,095,446.33 | 4% | |
| Social Equality: | $2,668,886,369,307.91 | 5% | |
| Free FlandersWhite Market Economic Statistics ? | |||
| Gross Domestic Product: | $46,101,300,000,000.00 | ||
| GDP Per Capita: | $2,030.80 | ||
| Average Salary Per Employee: | $3,571.36 | ||
| Unemployment Rate: | 24.05% | ||
| Consumption: | $141,805,150,116,249.59 | ||
| Exports: | $23,970,524,921,856.00 | ||
| Imports: | $24,156,701,720,576.00 | ||
| Trade Net: | -186,176,798,720.00 | ||
| Free Flanders Non Market Statistics ? Evasion, Black Market, Barter & Crime | |||
| Black & Grey Markets Combined: | $55,948,654,757,765.82 | ||
| Avg Annual Criminal's Income / Savings: ? | $1,797.97 | ||
| Recovered Product + Fines & Fees: | $4,615,764,017,515.68 | ||
| Black Market & Non Monetary Trade: | |||
| Guns & Weapons: | $2,450,503,871,712.69 | ||
| Drugs and Pharmaceuticals: | $2,779,676,033,584.55 | ||
| Extortion & Blackmail: | $2,194,481,079,145.69 | ||
| Counterfeit Goods: | $3,364,870,988,023.40 | ||
| Trafficking & Intl Sales: | $2,121,331,709,840.84 | ||
| Theft & Disappearance: | $2,487,078,556,365.12 | ||
| Counterfeit Currency & Instruments : | $4,388,962,158,291.39 | ||
| Illegal Mining, Logging, and Hunting : | $1,389,838,016,792.27 | ||
| Basic Necessitites : | $2,925,974,772,194.26 | ||
| School Loan Fraud : | $1,901,883,601,926.27 | ||
| Tax Evasion + Barter Trade : | $24,057,921,545,839.30 | ||
| Free Flanders Total Market Statistics ? | |||
| National Currency: | Euro | ||
| Exchange Rates: | 1 Euro = $0.19 | ||
| $1 = 5.15 Euros | |||
| Regional Exchange Rates | |||
| Gross Domestic Product: | $46,101,300,000,000.00 - 45% | ||
| Black & Grey Markets Combined: | $55,948,654,757,765.82 - 55% | ||
| Real Total Economy: | $102,049,954,757,765.81 | ||
| United opia nations Economic Statistics & Links | |||
| Gross Regional Product: | $216,804,144,185,344 | ||
| Region Wide Imports: | $29,318,591,807,488 | ||
| Largest Regional GDP: | Free Flanders | ||
| Largest Regional Importer: | Free Flanders | ||
| Regional Search Functions: | All United opia nations Nations. | ||
| Regional Nations by GDP | Regional Trading Leaders | |||
| Regional Exchange Rates | WA Members | |||
| Returns to standard Version: | FAQ | About | About | 582,885,877 uses since September 1, 2011. | |
Version 3.69 HTML4. V 0.7 is HTML1. |
Like our Calculator? Tell your friends for us... |