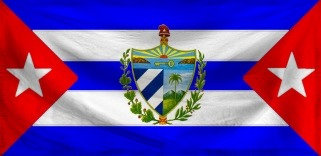
The Republic of Greater Miami Shores 1
Make Miami Great Again
Region: Greater Miami Shores 1
Quicksearch Query: Greater Miami Shores 1
|
Quicksearch: | |
NS Economy Mobile Home |
Regions Search |
Greater Miami Shores 1 NS Page |
|
| GDP Leaders | Export Leaders | Interesting Places BIG Populations | Most Worked | | Militaristic States | Police States | |

Make Miami Great Again
Region: Greater Miami Shores 1
Quicksearch Query: Greater Miami Shores 1
| Greater Miami Shores 1 Domestic Statistics | |||
|---|---|---|---|
| Government Category: | Republic | ||
| Government Priority: | Religion & Spirituality | ||
| Economic Rating: | Very Strong | ||
| Civil Rights Rating: | Some | ||
| Political Freedoms: | Excellent | ||
| Income Tax Rate: | 15% | ||
| Consumer Confidence Rate: | 99% | ||
| Worker Enthusiasm Rate: | 102% | ||
| Major Industry: | Pizza Delivery | ||
| National Animal: | El Sinsonte and El Toc | ||
| Greater Miami Shores 1 Demographics | |||
| Total Population: | 7,491,000,000 | ||
| Criminals: | 776,427,591 | ||
| Elderly, Disabled, & Retirees: | 1,074,694,930 | ||
| Military & Reserves: ? | 312,073,243 | ||
| Students and Youth: | 1,237,887,750 | ||
| Unemployed but Able: | 1,151,226,780 | ||
| Working Class: | 2,938,689,706 | ||
| Greater Miami Shores 1 Government Budget Details | |||
| Government Budget: | $30,541,491,409,854.14 | ||
| Government Expenditures: | $29,930,661,581,657.05 | ||
| Goverment Waste: | $610,829,828,197.08 | ||
| Goverment Efficiency: | 98% | ||
| Greater Miami Shores 1 Government Spending Breakdown: | |||
| Administration: | $2,095,146,310,715.99 | 7% | |
| Social Welfare: | $0.00 | 0% | |
| Healthcare: | $2,693,759,542,349.13 | 9% | |
| Education: | $2,095,146,310,715.99 | 7% | |
| Religion & Spirituality: | $9,278,505,090,313.69 | 31% | |
| Defense: | $4,788,905,853,065.13 | 16% | |
| Law & Order: | $4,788,905,853,065.13 | 16% | |
| Commerce: | $1,795,839,694,899.42 | 6% | |
| Public Transport: | $2,095,146,310,715.99 | 7% | |
| The Environment: | $299,306,615,816.57 | 1% | |
| Social Equality: | $0.00 | 0% | |
| Greater Miami Shores 1White Market Economic Statistics ? | |||
| Gross Domestic Product: | $26,534,100,000,000.00 | ||
| GDP Per Capita: | $3,542.13 | ||
| Average Salary Per Employee: | $5,926.51 | ||
| Unemployment Rate: | 22.51% | ||
| Consumption: | $96,502,983,897,907.20 | ||
| Exports: | $15,973,520,073,728.00 | ||
| Imports: | $15,964,050,554,880.00 | ||
| Trade Net: | 9,469,518,848.00 | ||
| Greater Miami Shores 1 Non Market Statistics ? Evasion, Black Market, Barter & Crime | |||
| Black & Grey Markets Combined: | $51,871,513,779,475.75 | ||
| Avg Annual Criminal's Income / Savings: ? | $5,680.95 | ||
| Recovered Product + Fines & Fees: | $6,224,581,653,537.09 | ||
| Black Market & Non Monetary Trade: | |||
| Guns & Weapons: | $3,089,726,718,274.47 | ||
| Drugs and Pharmaceuticals: | $3,642,625,183,649.91 | ||
| Extortion & Blackmail: | $1,691,218,835,266.03 | ||
| Counterfeit Goods: | $3,902,812,696,767.75 | ||
| Trafficking & Intl Sales: | $2,992,156,400,855.28 | ||
| Theft & Disappearance: | $1,170,843,809,030.33 | ||
| Counterfeit Currency & Instruments : | $4,032,906,453,326.68 | ||
| Illegal Mining, Logging, and Hunting : | $585,421,904,515.16 | ||
| Basic Necessitites : | $455,328,147,956.24 | ||
| School Loan Fraud : | $975,703,174,191.94 | ||
| Tax Evasion + Barter Trade : | $22,304,750,925,174.57 | ||
| Greater Miami Shores 1 Total Market Statistics ? | |||
| National Currency: | Peso | ||
| Exchange Rates: | 1 Peso = $0.36 | ||
| $1 = 2.76 Pesos | |||
| Regional Exchange Rates | |||
| Gross Domestic Product: | $26,534,100,000,000.00 - 34% | ||
| Black & Grey Markets Combined: | $51,871,513,779,475.75 - 66% | ||
| Real Total Economy: | $78,405,613,779,475.75 | ||
| Greater Miami Shores 1 Economic Statistics & Links | |||
| Gross Regional Product: | $257,046,427,467,776 | ||
| Region Wide Imports: | $36,165,159,747,584 | ||
| Largest Regional GDP: | NS Uruguay | ||
| Largest Regional Importer: | NS Uruguay | ||
| Regional Search Functions: | All Greater Miami Shores 1 Nations. | ||
| Regional Nations by GDP | Regional Trading Leaders | |||
| Regional Exchange Rates | WA Members | |||
| Returns to standard Version: | FAQ | About | About | 596,692,373 uses since September 1, 2011. | |
Version 3.69 HTML4. V 0.7 is HTML1. |
Like our Calculator? Tell your friends for us... |