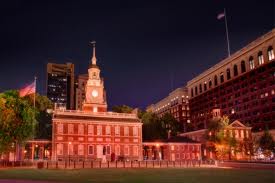
The Free Land of Independence Hall
...Life, Liberty and the Pursuit of Happiness
Region: Philadelphia
Quicksearch Query: Independence Hall
|
Quicksearch: | |
NS Economy Mobile Home |
Regions Search |
Independence Hall NS Page |
|
| GDP Leaders | Export Leaders | Interesting Places BIG Populations | Most Worked | | Militaristic States | Police States | |
...Life, Liberty and the Pursuit of Happiness
Region: Philadelphia
Quicksearch Query: Independence Hall
| Independence Hall Domestic Statistics | |||
|---|---|---|---|
| Government Category: | Free Land | ||
| Government Priority: | Social Welfare | ||
| Economic Rating: | Strong | ||
| Civil Rights Rating: | Excessive | ||
| Political Freedoms: | Excessive | ||
| Income Tax Rate: | 49% | ||
| Consumer Confidence Rate: | 102% | ||
| Worker Enthusiasm Rate: | 105% | ||
| Major Industry: | Door-to-door Insurance Sales | ||
| National Animal: | eagle | ||
| Independence Hall Demographics | |||
| Total Population: | 29,892,000,000 | ||
| Criminals: | 3,059,907,105 | ||
| Elderly, Disabled, & Retirees: | 3,620,574,956 | ||
| Military & Reserves: ? | 554,384,465 | ||
| Students and Youth: | 5,515,074,000 | ||
| Unemployed but Able: | 4,496,813,813 | ||
| Working Class: | 12,645,245,660 | ||
| Independence Hall Government Budget Details | |||
| Government Budget: | $188,390,337,803,609.69 | ||
| Government Expenditures: | $178,970,820,913,429.19 | ||
| Goverment Waste: | $9,419,516,890,180.50 | ||
| Goverment Efficiency: | 95% | ||
| Independence Hall Government Spending Breakdown: | |||
| Administration: | $12,527,957,463,940.04 | 7% | |
| Social Welfare: | $23,266,206,718,745.80 | 13% | |
| Healthcare: | $12,527,957,463,940.04 | 7% | |
| Education: | $17,897,082,091,342.92 | 10% | |
| Religion & Spirituality: | $17,897,082,091,342.92 | 10% | |
| Defense: | $12,527,957,463,940.04 | 7% | |
| Law & Order: | $12,527,957,463,940.04 | 7% | |
| Commerce: | $12,527,957,463,940.04 | 7% | |
| Public Transport: | $12,527,957,463,940.04 | 7% | |
| The Environment: | $12,527,957,463,940.04 | 7% | |
| Social Equality: | $12,527,957,463,940.04 | 7% | |
| Independence HallWhite Market Economic Statistics ? | |||
| Gross Domestic Product: | $147,326,000,000,000.00 | ||
| GDP Per Capita: | $4,928.61 | ||
| Average Salary Per Employee: | $8,110.64 | ||
| Unemployment Rate: | 21.15% | ||
| Consumption: | $163,584,093,097,820.16 | ||
| Exports: | $41,770,113,335,296.00 | ||
| Imports: | $41,981,543,710,720.00 | ||
| Trade Net: | -211,430,375,424.00 | ||
| Independence Hall Non Market Statistics ? Evasion, Black Market, Barter & Crime | |||
| Black & Grey Markets Combined: | $250,563,292,202,561.91 | ||
| Avg Annual Criminal's Income / Savings: ? | $5,882.61 | ||
| Recovered Product + Fines & Fees: | $13,154,572,840,634.50 | ||
| Black Market & Non Monetary Trade: | |||
| Guns & Weapons: | $6,427,841,076,724.19 | ||
| Drugs and Pharmaceuticals: | $11,502,452,453,085.38 | ||
| Extortion & Blackmail: | $9,472,607,902,540.90 | ||
| Counterfeit Goods: | $11,840,759,878,176.13 | ||
| Trafficking & Intl Sales: | $10,487,530,177,813.14 | ||
| Theft & Disappearance: | $9,472,607,902,540.90 | ||
| Counterfeit Currency & Instruments : | $11,840,759,878,176.13 | ||
| Illegal Mining, Logging, and Hunting : | $7,104,455,926,905.68 | ||
| Basic Necessitites : | $14,547,219,278,902.10 | ||
| School Loan Fraud : | $9,134,300,477,450.16 | ||
| Tax Evasion + Barter Trade : | $107,742,215,647,101.62 | ||
| Independence Hall Total Market Statistics ? | |||
| National Currency: | right | ||
| Exchange Rates: | 1 right = $0.35 | ||
| $1 = 2.86 rights | |||
| Regional Exchange Rates | |||
| Gross Domestic Product: | $147,326,000,000,000.00 - 37% | ||
| Black & Grey Markets Combined: | $250,563,292,202,561.91 - 63% | ||
| Real Total Economy: | $397,889,292,202,561.88 | ||
| Philadelphia Economic Statistics & Links | |||
| Gross Regional Product: | $629,747,902,054,400 | ||
| Region Wide Imports: | $82,008,994,742,272 | ||
| Largest Regional GDP: | Independence Hall | ||
| Largest Regional Importer: | Independence Hall | ||
| Regional Search Functions: | All Philadelphia Nations. | ||
| Regional Nations by GDP | Regional Trading Leaders | |||
| Regional Exchange Rates | WA Members | |||
| Returns to standard Version: | FAQ | About | About | 598,833,895 uses since September 1, 2011. | |
Version 3.69 HTML4. V 0.7 is HTML1. |
Like our Calculator? Tell your friends for us... |