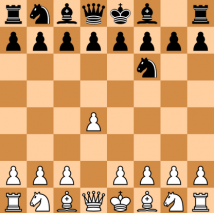
The Republic of Indian Defense
Chess Openings
Region: Giovanniland
Quicksearch Query: Indian Defense
|
Quicksearch: | |
NS Economy Mobile Home |
Regions Search |
Indian Defense NS Page |
|
| GDP Leaders | Export Leaders | Interesting Places BIG Populations | Most Worked | | Militaristic States | Police States | |

Chess Openings
Region: Giovanniland
Quicksearch Query: Indian Defense
| Indian Defense Domestic Statistics | |||
|---|---|---|---|
| Government Category: | Republic | ||
| Government Priority: | Law & Order | ||
| Economic Rating: | Frightening | ||
| Civil Rights Rating: | Unheard Of | ||
| Political Freedoms: | Below Average | ||
| Income Tax Rate: | 68% | ||
| Consumer Confidence Rate: | 96% | ||
| Worker Enthusiasm Rate: | 98% | ||
| Major Industry: | Arms Manufacturing | ||
| National Animal: | king | ||
| Indian Defense Demographics | |||
| Total Population: | 9,240,000,000 | ||
| Criminals: | 602,053,362 | ||
| Elderly, Disabled, & Retirees: | 919,317,443 | ||
| Military & Reserves: ? | 363,116,690 | ||
| Students and Youth: | 1,918,224,000 | ||
| Unemployed but Able: | 1,145,063,020 | ||
| Working Class: | 4,292,225,485 | ||
| Indian Defense Government Budget Details | |||
| Government Budget: | $232,039,178,589,490.34 | ||
| Government Expenditures: | $220,437,219,660,015.81 | ||
| Goverment Waste: | $11,601,958,929,474.53 | ||
| Goverment Efficiency: | 95% | ||
| Indian Defense Government Spending Breakdown: | |||
| Administration: | $26,452,466,359,201.90 | 12% | |
| Social Welfare: | $11,021,860,983,000.79 | 5% | |
| Healthcare: | $19,839,349,769,401.42 | 9% | |
| Education: | $30,861,210,752,402.21 | 14% | |
| Religion & Spirituality: | $4,408,744,393,200.32 | 2% | |
| Defense: | $28,656,838,555,802.05 | 13% | |
| Law & Order: | $37,474,327,342,202.69 | 17% | |
| Commerce: | $30,861,210,752,402.21 | 14% | |
| Public Transport: | $4,408,744,393,200.32 | 2% | |
| The Environment: | $6,613,116,589,800.48 | 3% | |
| Social Equality: | $19,839,349,769,401.42 | 9% | |
| Indian DefenseWhite Market Economic Statistics ? | |||
| Gross Domestic Product: | $175,890,000,000,000.00 | ||
| GDP Per Capita: | $19,035.71 | ||
| Average Salary Per Employee: | $25,059.32 | ||
| Unemployment Rate: | 10.03% | ||
| Consumption: | $97,639,681,973,288.97 | ||
| Exports: | $38,367,990,644,736.00 | ||
| Imports: | $41,418,772,971,520.00 | ||
| Trade Net: | -3,050,782,326,784.00 | ||
| Indian Defense Non Market Statistics ? Evasion, Black Market, Barter & Crime | |||
| Black & Grey Markets Combined: | $657,746,913,164,475.12 | ||
| Avg Annual Criminal's Income / Savings: ? | $91,042.17 | ||
| Recovered Product + Fines & Fees: | $83,862,731,428,470.58 | ||
| Black Market & Non Monetary Trade: | |||
| Guns & Weapons: | $22,080,193,892,292.77 | ||
| Drugs and Pharmaceuticals: | $27,804,688,605,109.41 | ||
| Extortion & Blackmail: | $42,524,817,866,637.94 | ||
| Counterfeit Goods: | $61,333,871,923,035.48 | ||
| Trafficking & Intl Sales: | $7,360,064,630,764.26 | ||
| Theft & Disappearance: | $29,440,258,523,057.03 | ||
| Counterfeit Currency & Instruments : | $58,062,732,087,140.25 | ||
| Illegal Mining, Logging, and Hunting : | $6,542,279,671,790.45 | ||
| Basic Necessitites : | $26,986,903,646,135.61 | ||
| School Loan Fraud : | $25,351,333,728,188.00 | ||
| Tax Evasion + Barter Trade : | $282,831,172,660,724.31 | ||
| Indian Defense Total Market Statistics ? | |||
| National Currency: | pawn | ||
| Exchange Rates: | 1 pawn = $1.28 | ||
| $1 = 0.78 pawns | |||
| Regional Exchange Rates | |||
| Gross Domestic Product: | $175,890,000,000,000.00 - 21% | ||
| Black & Grey Markets Combined: | $657,746,913,164,475.12 - 79% | ||
| Real Total Economy: | $833,636,913,164,475.12 | ||
| Giovanniland Economic Statistics & Links | |||
| Gross Regional Product: | $194,250,238,242,848,768 | ||
| Region Wide Imports: | $24,426,106,077,577,216 | ||
| Largest Regional GDP: | GiovanniCards | ||
| Largest Regional Importer: | GiovanniCards | ||
| Regional Search Functions: | All Giovanniland Nations. | ||
| Regional Nations by GDP | Regional Trading Leaders | |||
| Regional Exchange Rates | WA Members | |||
| Returns to standard Version: | FAQ | About | About | 594,426,050 uses since September 1, 2011. | |
Version 3.69 HTML4. V 0.7 is HTML1. |
Like our Calculator? Tell your friends for us... |