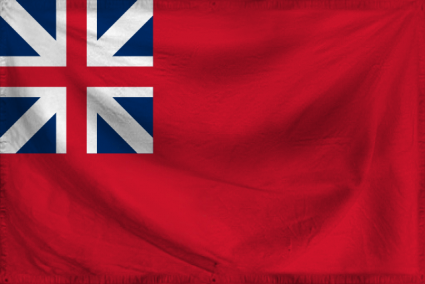
The Colony of Massachusetts Bay
Ense Petit Placidam, Sub Libertate Quietem
Region: the West Pacific
Quicksearch Query: Massachusetts Bay
|
Quicksearch: | |
NS Economy Mobile Home |
Regions Search |
Massachusetts Bay NS Page |
|
| GDP Leaders | Export Leaders | Interesting Places BIG Populations | Most Worked | | Militaristic States | Police States | |

Ense Petit Placidam, Sub Libertate Quietem
Region: the West Pacific
Quicksearch Query: Massachusetts Bay
| Massachusetts Bay Domestic Statistics | |||
|---|---|---|---|
| Government Category: | Colony | ||
| Government Priority: | Social Welfare | ||
| Economic Rating: | Good | ||
| Civil Rights Rating: | Very Good | ||
| Political Freedoms: | Superb | ||
| Income Tax Rate: | 14% | ||
| Consumer Confidence Rate: | 102% | ||
| Worker Enthusiasm Rate: | 105% | ||
| Major Industry: | Beef-Based Agriculture | ||
| National Animal: | eagle | ||
| Massachusetts Bay Demographics | |||
| Total Population: | 4,718,000,000 | ||
| Criminals: | 516,862,600 | ||
| Elderly, Disabled, & Retirees: | 651,840,882 | ||
| Military & Reserves: ? | 167,944,435 | ||
| Students and Youth: | 804,419,000 | ||
| Unemployed but Able: | 745,539,011 | ||
| Working Class: | 1,831,394,073 | ||
| Massachusetts Bay Government Budget Details | |||
| Government Budget: | $9,968,333,998,448.97 | ||
| Government Expenditures: | $9,768,967,318,479.99 | ||
| Goverment Waste: | $199,366,679,968.98 | ||
| Goverment Efficiency: | 98% | ||
| Massachusetts Bay Government Spending Breakdown: | |||
| Administration: | $781,517,385,478.40 | 8% | |
| Social Welfare: | $2,051,483,136,880.80 | 21% | |
| Healthcare: | $1,367,655,424,587.20 | 14% | |
| Education: | $1,465,345,097,772.00 | 15% | |
| Religion & Spirituality: | $0.00 | 0% | |
| Defense: | $1,367,655,424,587.20 | 14% | |
| Law & Order: | $1,269,965,751,402.40 | 13% | |
| Commerce: | $97,689,673,184.80 | 1% | |
| Public Transport: | $781,517,385,478.40 | 8% | |
| The Environment: | $97,689,673,184.80 | 1% | |
| Social Equality: | $390,758,692,739.20 | 4% | |
| Massachusetts BayWhite Market Economic Statistics ? | |||
| Gross Domestic Product: | $8,307,040,000,000.00 | ||
| GDP Per Capita: | $1,760.71 | ||
| Average Salary Per Employee: | $3,157.67 | ||
| Unemployment Rate: | 24.33% | ||
| Consumption: | $32,610,332,421,652.48 | ||
| Exports: | $4,793,416,679,424.00 | ||
| Imports: | $5,193,608,462,336.00 | ||
| Trade Net: | -400,191,782,912.00 | ||
| Massachusetts Bay Non Market Statistics ? Evasion, Black Market, Barter & Crime | |||
| Black & Grey Markets Combined: | $8,177,791,011,371.42 | ||
| Avg Annual Criminal's Income / Savings: ? | $1,280.10 | ||
| Recovered Product + Fines & Fees: | $797,334,623,608.71 | ||
| Black Market & Non Monetary Trade: | |||
| Guns & Weapons: | $294,480,209,871.73 | ||
| Drugs and Pharmaceuticals: | $452,237,465,160.16 | ||
| Extortion & Blackmail: | $189,308,706,346.11 | ||
| Counterfeit Goods: | $441,720,314,807.60 | ||
| Trafficking & Intl Sales: | $178,791,555,993.55 | ||
| Theft & Disappearance: | $378,617,412,692.23 | ||
| Counterfeit Currency & Instruments : | $588,960,419,743.46 | ||
| Illegal Mining, Logging, and Hunting : | $105,171,503,525.62 | ||
| Basic Necessitites : | $641,546,171,506.27 | ||
| School Loan Fraud : | $326,031,660,929.42 | ||
| Tax Evasion + Barter Trade : | $3,516,450,134,889.71 | ||
| Massachusetts Bay Total Market Statistics ? | |||
| National Currency: | dollar | ||
| Exchange Rates: | 1 dollar = $0.18 | ||
| $1 = 5.53 dollars | |||
| Regional Exchange Rates | |||
| Gross Domestic Product: | $8,307,040,000,000.00 - 50% | ||
| Black & Grey Markets Combined: | $8,177,791,011,371.42 - 50% | ||
| Real Total Economy: | $16,484,831,011,371.42 | ||
| the West Pacific Economic Statistics & Links | |||
| Gross Regional Product: | $252,301,084,935,061,504 | ||
| Region Wide Imports: | $31,893,892,416,667,648 | ||
| Largest Regional GDP: | BIteland | ||
| Largest Regional Importer: | BIteland | ||
| Regional Search Functions: | All the West Pacific Nations. | ||
| Regional Nations by GDP | Regional Trading Leaders | |||
| Regional Exchange Rates | WA Members | |||
| Returns to standard Version: | FAQ | About | About | 597,055,670 uses since September 1, 2011. | |
Version 3.69 HTML4. V 0.7 is HTML1. |
Like our Calculator? Tell your friends for us... |