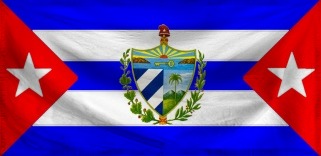
The Republic of NS Greater Miami Shores
Make Miami Great Again Adelante Forward
Region: Balder
Quicksearch Query: NS Greater Miami Shores
|
Quicksearch: | |
NS Economy Mobile Home |
Regions Search |
NS Greater Miami Shores NS Page |
|
| GDP Leaders | Export Leaders | Interesting Places BIG Populations | Most Worked | | Militaristic States | Police States | |

Make Miami Great Again Adelante Forward
Region: Balder
Quicksearch Query: NS Greater Miami Shores
| NS Greater Miami Shores Domestic Statistics | |||
|---|---|---|---|
| Government Category: | Republic | ||
| Government Priority: | Defence | ||
| Economic Rating: | Strong | ||
| Civil Rights Rating: | Some | ||
| Political Freedoms: | Few | ||
| Income Tax Rate: | 8% | ||
| Consumer Confidence Rate: | 99% | ||
| Worker Enthusiasm Rate: | 99% | ||
| Major Industry: | Arms Manufacturing | ||
| National Animal: | El Sinsonte | ||
| NS Greater Miami Shores Demographics | |||
| Total Population: | 16,391,000,000 | ||
| Criminals: | 1,932,271,533 | ||
| Elderly, Disabled, & Retirees: | 2,252,657,923 | ||
| Military & Reserves: ? | 995,670,243 | ||
| Students and Youth: | 2,688,124,000 | ||
| Unemployed but Able: | 2,603,569,858 | ||
| Working Class: | 5,918,706,444 | ||
| NS Greater Miami Shores Government Budget Details | |||
| Government Budget: | $30,125,669,852,014.18 | ||
| Government Expenditures: | $27,715,616,263,853.05 | ||
| Goverment Waste: | $2,410,053,588,161.13 | ||
| Goverment Efficiency: | 92% | ||
| NS Greater Miami Shores Government Spending Breakdown: | |||
| Administration: | $2,771,561,626,385.30 | 10% | |
| Social Welfare: | $0.00 | 0% | |
| Healthcare: | $2,771,561,626,385.30 | 10% | |
| Education: | $2,771,561,626,385.30 | 10% | |
| Religion & Spirituality: | $0.00 | 0% | |
| Defense: | $6,651,747,903,324.73 | 24% | |
| Law & Order: | $5,820,279,415,409.14 | 21% | |
| Commerce: | $2,217,249,301,108.24 | 8% | |
| Public Transport: | $2,771,561,626,385.30 | 10% | |
| The Environment: | $2,771,561,626,385.30 | 10% | |
| Social Equality: | $0.00 | 0% | |
| NS Greater Miami ShoresWhite Market Economic Statistics ? | |||
| Gross Domestic Product: | $23,471,900,000,000.00 | ||
| GDP Per Capita: | $1,432.00 | ||
| Average Salary Per Employee: | $2,526.42 | ||
| Unemployment Rate: | 24.67% | ||
| Consumption: | $147,856,048,353,443.84 | ||
| Exports: | $20,496,046,751,744.00 | ||
| Imports: | $22,168,312,217,600.00 | ||
| Trade Net: | -1,672,265,465,856.00 | ||
| NS Greater Miami Shores Non Market Statistics ? Evasion, Black Market, Barter & Crime | |||
| Black & Grey Markets Combined: | $42,311,236,052,358.88 | ||
| Avg Annual Criminal's Income / Savings: ? | $2,146.78 | ||
| Recovered Product + Fines & Fees: | $6,664,019,678,246.52 | ||
| Black Market & Non Monetary Trade: | |||
| Guns & Weapons: | $2,438,269,599,989.28 | ||
| Drugs and Pharmaceuticals: | $1,523,918,499,993.30 | ||
| Extortion & Blackmail: | $1,828,702,199,991.96 | ||
| Counterfeit Goods: | $4,165,377,233,315.03 | ||
| Trafficking & Intl Sales: | $1,523,918,499,993.30 | ||
| Theft & Disappearance: | $1,015,945,666,662.20 | ||
| Counterfeit Currency & Instruments : | $4,368,566,366,647.47 | ||
| Illegal Mining, Logging, and Hunting : | $1,523,918,499,993.30 | ||
| Basic Necessitites : | $507,972,833,331.10 | ||
| School Loan Fraud : | $1,523,918,499,993.30 | ||
| Tax Evasion + Barter Trade : | $18,193,831,502,514.32 | ||
| NS Greater Miami Shores Total Market Statistics ? | |||
| National Currency: | Peso | ||
| Exchange Rates: | 1 Peso = $0.19 | ||
| $1 = 5.31 Pesos | |||
| Regional Exchange Rates | |||
| Gross Domestic Product: | $23,471,900,000,000.00 - 36% | ||
| Black & Grey Markets Combined: | $42,311,236,052,358.88 - 64% | ||
| Real Total Economy: | $65,783,136,052,358.88 | ||
| Balder Economic Statistics & Links | |||
| Gross Regional Product: | $1,632,768,719,933,407,232 | ||
| Region Wide Imports: | $208,230,099,093,291,008 | ||
| Largest Regional GDP: | Nianacio | ||
| Largest Regional Importer: | Nianacio | ||
| Regional Search Functions: | All Balder Nations. | ||
| Regional Nations by GDP | Regional Trading Leaders | |||
| Regional Exchange Rates | WA Members | |||
| Returns to standard Version: | FAQ | About | About | 589,159,823 uses since September 1, 2011. | |
Version 3.69 HTML4. V 0.7 is HTML1. |
Like our Calculator? Tell your friends for us... |