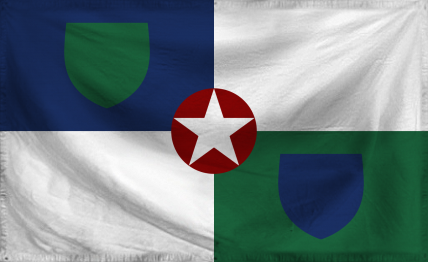
The Socialist Stratocracy of Northern Shartland
Who up liberating they proletariat?
Region: The Continent of Shartland
Quicksearch Query: Northern Shartland
|
Quicksearch: | |
NS Economy Mobile Home |
Regions Search |
Northern Shartland NS Page |
|
| GDP Leaders | Export Leaders | Interesting Places BIG Populations | Most Worked | | Militaristic States | Police States | |

Who up liberating they proletariat?
Region: The Continent of Shartland
Quicksearch Query: Northern Shartland
| Northern Shartland Domestic Statistics | |||
|---|---|---|---|
| Government Category: | Socialist Stratocracy | ||
| Government Priority: | Administration | ||
| Economic Rating: | Frightening | ||
| Civil Rights Rating: | Excellent | ||
| Political Freedoms: | Some | ||
| Income Tax Rate: | 81% | ||
| Consumer Confidence Rate: | 107% | ||
| Worker Enthusiasm Rate: | 106% | ||
| Major Industry: | Information Technology | ||
| National Animal: | Skunk | ||
| Northern Shartland Demographics | |||
| Total Population: | 1,611,000,000 | ||
| Criminals: | 84,464,775 | ||
| Elderly, Disabled, & Retirees: | 132,531,245 | ||
| Military & Reserves: ? | 45,762,355 | ||
| Students and Youth: | 362,152,800 | ||
| Unemployed but Able: | 184,400,166 | ||
| Working Class: | 801,688,660 | ||
| Northern Shartland Government Budget Details | |||
| Government Budget: | $56,889,496,717,838.26 | ||
| Government Expenditures: | $53,476,126,914,767.96 | ||
| Goverment Waste: | $3,413,369,803,070.30 | ||
| Goverment Efficiency: | 94% | ||
| Northern Shartland Government Spending Breakdown: | |||
| Administration: | $9,090,941,575,510.56 | 17% | |
| Social Welfare: | $5,347,612,691,476.80 | 10% | |
| Healthcare: | $4,278,090,153,181.44 | 8% | |
| Education: | $8,556,180,306,362.87 | 16% | |
| Religion & Spirituality: | $0.00 | 0% | |
| Defense: | $4,812,851,422,329.12 | 9% | |
| Law & Order: | $3,743,328,884,033.76 | 7% | |
| Commerce: | $5,347,612,691,476.80 | 10% | |
| Public Transport: | $3,208,567,614,886.08 | 6% | |
| The Environment: | $3,743,328,884,033.76 | 7% | |
| Social Equality: | $4,278,090,153,181.44 | 8% | |
| Northern ShartlandWhite Market Economic Statistics ? | |||
| Gross Domestic Product: | $43,066,600,000,000.00 | ||
| GDP Per Capita: | $26,732.84 | ||
| Average Salary Per Employee: | $39,603.89 | ||
| Unemployment Rate: | 6.06% | ||
| Consumption: | $12,187,536,646,471.68 | ||
| Exports: | $7,653,473,593,344.00 | ||
| Imports: | $7,671,518,330,880.00 | ||
| Trade Net: | -18,044,737,536.00 | ||
| Northern Shartland Non Market Statistics ? Evasion, Black Market, Barter & Crime | |||
| Black & Grey Markets Combined: | $83,822,448,035,153.88 | ||
| Avg Annual Criminal's Income / Savings: ? | $72,543.52 | ||
| Recovered Product + Fines & Fees: | $4,400,678,521,845.58 | ||
| Black Market & Non Monetary Trade: | |||
| Guns & Weapons: | $2,037,168,388,016.36 | ||
| Drugs and Pharmaceuticals: | $3,621,632,689,806.86 | ||
| Extortion & Blackmail: | $6,111,505,164,049.07 | ||
| Counterfeit Goods: | $4,866,568,926,927.97 | ||
| Trafficking & Intl Sales: | $2,150,344,409,572.82 | ||
| Theft & Disappearance: | $3,621,632,689,806.86 | ||
| Counterfeit Currency & Instruments : | $6,451,033,228,718.47 | ||
| Illegal Mining, Logging, and Hunting : | $2,263,520,431,129.29 | ||
| Basic Necessitites : | $4,979,744,948,484.43 | ||
| School Loan Fraud : | $4,413,864,840,702.11 | ||
| Tax Evasion + Barter Trade : | $36,043,652,655,116.16 | ||
| Northern Shartland Total Market Statistics ? | |||
| National Currency: | Shart | ||
| Exchange Rates: | 1 Shart = $1.52 | ||
| $1 = 0.66 Sharts | |||
| Regional Exchange Rates | |||
| Gross Domestic Product: | $43,066,600,000,000.00 - 34% | ||
| Black & Grey Markets Combined: | $83,822,448,035,153.88 - 66% | ||
| Real Total Economy: | $126,889,048,035,153.88 | ||
| The Continent of Shartland Economic Statistics & Links | |||
| Gross Regional Product: | $76,150,801,956,864 | ||
| Region Wide Imports: | $9,085,958,225,920 | ||
| Largest Regional GDP: | Northern Shartland | ||
| Largest Regional Importer: | Northern Shartland | ||
| Regional Search Functions: | All The Continent of Shartland Nations. | ||
| Regional Nations by GDP | Regional Trading Leaders | |||
| Regional Exchange Rates | WA Members | |||
| Returns to standard Version: | FAQ | About | About | 588,990,353 uses since September 1, 2011. | |
Version 3.69 HTML4. V 0.7 is HTML1. |
Like our Calculator? Tell your friends for us... |