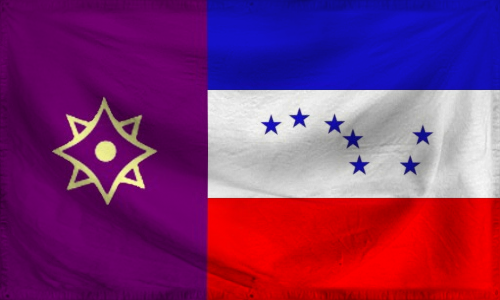
The Mandate of Pacific Federation Company
Northern Star shall lead us forward
Region: Tri Sea Pact
Quicksearch Query: Pacific Federation Company
|
Quicksearch: | |
NS Economy Mobile Home |
Regions Search |
Pacific Federation Company NS Page |
|
| GDP Leaders | Export Leaders | Interesting Places BIG Populations | Most Worked | | Militaristic States | Police States | |

Northern Star shall lead us forward
Region: Tri Sea Pact
Quicksearch Query: Pacific Federation Company
| Pacific Federation Company Domestic Statistics | |||
|---|---|---|---|
| Government Category: | Mandate | ||
| Government Priority: | Law & Order | ||
| Economic Rating: | Frightening | ||
| Civil Rights Rating: | Average | ||
| Political Freedoms: | Some | ||
| Income Tax Rate: | 70% | ||
| Consumer Confidence Rate: | 104% | ||
| Worker Enthusiasm Rate: | 103% | ||
| Major Industry: | Information Technology | ||
| National Animal: | Double-Headed Eagle | ||
| Pacific Federation Company Demographics | |||
| Total Population: | 4,341,000,000 | ||
| Criminals: | 256,959,580 | ||
| Elderly, Disabled, & Retirees: | 454,635,557 | ||
| Military & Reserves: ? | 120,686,698 | ||
| Students and Youth: | 876,882,000 | ||
| Unemployed but Able: | 517,584,004 | ||
| Working Class: | 2,114,252,160 | ||
| Pacific Federation Company Government Budget Details | |||
| Government Budget: | $127,286,545,148,784.12 | ||
| Government Expenditures: | $119,649,352,439,857.08 | ||
| Goverment Waste: | $7,637,192,708,927.05 | ||
| Goverment Efficiency: | 94% | ||
| Pacific Federation Company Government Spending Breakdown: | |||
| Administration: | $15,554,415,817,181.42 | 13% | |
| Social Welfare: | $10,768,441,719,587.14 | 9% | |
| Healthcare: | $14,357,922,292,782.85 | 12% | |
| Education: | $14,357,922,292,782.85 | 12% | |
| Religion & Spirituality: | $1,196,493,524,398.57 | 1% | |
| Defense: | $10,768,441,719,587.14 | 9% | |
| Law & Order: | $20,340,389,914,775.70 | 17% | |
| Commerce: | $14,357,922,292,782.85 | 12% | |
| Public Transport: | $5,982,467,621,992.86 | 5% | |
| The Environment: | $7,178,961,146,391.43 | 6% | |
| Social Equality: | $2,392,987,048,797.14 | 2% | |
| Pacific Federation CompanyWhite Market Economic Statistics ? | |||
| Gross Domestic Product: | $97,664,000,000,000.00 | ||
| GDP Per Capita: | $22,498.04 | ||
| Average Salary Per Employee: | $32,163.38 | ||
| Unemployment Rate: | 8.06% | ||
| Consumption: | $48,958,560,377,241.60 | ||
| Exports: | $21,128,593,997,824.00 | ||
| Imports: | $20,266,587,521,024.00 | ||
| Trade Net: | 862,006,476,800.00 | ||
| Pacific Federation Company Non Market Statistics ? Evasion, Black Market, Barter & Crime | |||
| Black & Grey Markets Combined: | $184,220,839,770,091.81 | ||
| Avg Annual Criminal's Income / Savings: ? | $57,445.94 | ||
| Recovered Product + Fines & Fees: | $23,488,157,070,686.71 | ||
| Black Market & Non Monetary Trade: | |||
| Guns & Weapons: | $4,237,315,347,663.07 | ||
| Drugs and Pharmaceuticals: | $8,474,630,695,326.13 | ||
| Extortion & Blackmail: | $11,452,203,642,332.61 | ||
| Counterfeit Goods: | $15,345,952,880,725.70 | ||
| Trafficking & Intl Sales: | $3,893,749,238,393.09 | ||
| Theft & Disappearance: | $6,413,234,039,706.26 | ||
| Counterfeit Currency & Instruments : | $15,804,041,026,419.00 | ||
| Illegal Mining, Logging, and Hunting : | $3,893,749,238,393.09 | ||
| Basic Necessitites : | $7,329,410,331,092.87 | ||
| School Loan Fraud : | $6,871,322,185,399.57 | ||
| Tax Evasion + Barter Trade : | $79,214,961,101,139.48 | ||
| Pacific Federation Company Total Market Statistics ? | |||
| National Currency: | Pacific Ruble | ||
| Exchange Rates: | 1 Pacific Ruble = $1.40 | ||
| $1 = 0.72 Pacific Rubles | |||
| Regional Exchange Rates | |||
| Gross Domestic Product: | $97,664,000,000,000.00 - 35% | ||
| Black & Grey Markets Combined: | $184,220,839,770,091.81 - 65% | ||
| Real Total Economy: | $281,884,839,770,091.81 | ||
| Tri Sea Pact Economic Statistics & Links | |||
| Gross Regional Product: | $423,813,078,581,248 | ||
| Region Wide Imports: | $54,870,329,524,224 | ||
| Largest Regional GDP: | Pacific Federation Company | ||
| Largest Regional Importer: | Pacific Federation Company | ||
| Regional Search Functions: | All Tri Sea Pact Nations. | ||
| Regional Nations by GDP | Regional Trading Leaders | |||
| Regional Exchange Rates | WA Members | |||
| Returns to standard Version: | FAQ | About | About | 595,935,514 uses since September 1, 2011. | |
Version 3.69 HTML4. V 0.7 is HTML1. |
Like our Calculator? Tell your friends for us... |