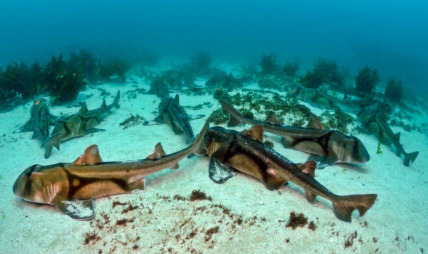
The Commonwealth of Port Jackson Shark
Heterodontus portusjacksoni
Region: Safari
Quicksearch Query: Port Jackson Shark
|
Quicksearch: | |
NS Economy Mobile Home |
Regions Search |
Port Jackson Shark NS Page |
|
| GDP Leaders | Export Leaders | Interesting Places BIG Populations | Most Worked | | Militaristic States | Police States | |
Heterodontus portusjacksoni
Region: Safari
Quicksearch Query: Port Jackson Shark
| Port Jackson Shark Domestic Statistics | |||
|---|---|---|---|
| Government Category: | Commonwealth | ||
| Government Priority: | Defence | ||
| Economic Rating: | Strong | ||
| Civil Rights Rating: | Some | ||
| Political Freedoms: | Very Good | ||
| Income Tax Rate: | 31% | ||
| Consumer Confidence Rate: | 99% | ||
| Worker Enthusiasm Rate: | 101% | ||
| Major Industry: | Arms Manufacturing | ||
| National Animal: | Port Jackson Shark | ||
| Port Jackson Shark Demographics | |||
| Total Population: | 6,914,000,000 | ||
| Criminals: | 725,794,449 | ||
| Elderly, Disabled, & Retirees: | 902,908,197 | ||
| Military & Reserves: ? | 359,678,783 | ||
| Students and Youth: | 1,224,123,700 | ||
| Unemployed but Able: | 1,063,850,462 | ||
| Working Class: | 2,637,644,409 | ||
| Port Jackson Shark Government Budget Details | |||
| Government Budget: | $29,155,009,058,360.53 | ||
| Government Expenditures: | $28,280,358,786,609.71 | ||
| Goverment Waste: | $874,650,271,750.82 | ||
| Goverment Efficiency: | 97% | ||
| Port Jackson Shark Government Spending Breakdown: | |||
| Administration: | $3,110,839,466,527.07 | 11% | |
| Social Welfare: | $1,979,625,115,062.68 | 7% | |
| Healthcare: | $1,979,625,115,062.68 | 7% | |
| Education: | $3,110,839,466,527.07 | 11% | |
| Religion & Spirituality: | $565,607,175,732.19 | 2% | |
| Defense: | $5,656,071,757,321.94 | 20% | |
| Law & Order: | $3,676,446,642,259.26 | 13% | |
| Commerce: | $2,262,428,702,928.78 | 8% | |
| Public Transport: | $1,696,821,527,196.58 | 6% | |
| The Environment: | $1,414,017,939,330.49 | 5% | |
| Social Equality: | $2,828,035,878,660.97 | 10% | |
| Port Jackson SharkWhite Market Economic Statistics ? | |||
| Gross Domestic Product: | $23,946,100,000,000.00 | ||
| GDP Per Capita: | $3,463.42 | ||
| Average Salary Per Employee: | $5,900.50 | ||
| Unemployment Rate: | 22.59% | ||
| Consumption: | $47,758,503,523,123.20 | ||
| Exports: | $9,558,218,698,752.00 | ||
| Imports: | $9,601,113,128,960.00 | ||
| Trade Net: | -42,894,430,208.00 | ||
| Port Jackson Shark Non Market Statistics ? Evasion, Black Market, Barter & Crime | |||
| Black & Grey Markets Combined: | $65,895,010,799,498.70 | ||
| Avg Annual Criminal's Income / Savings: ? | $7,799.84 | ||
| Recovered Product + Fines & Fees: | $6,424,763,552,951.12 | ||
| Black Market & Non Monetary Trade: | |||
| Guns & Weapons: | $3,474,549,195,379.54 | ||
| Drugs and Pharmaceuticals: | $2,288,117,762,810.92 | ||
| Extortion & Blackmail: | $3,220,313,888,400.55 | ||
| Counterfeit Goods: | $5,254,196,344,232.48 | ||
| Trafficking & Intl Sales: | $1,610,156,944,200.28 | ||
| Theft & Disappearance: | $2,881,333,479,095.23 | ||
| Counterfeit Currency & Instruments : | $5,762,666,958,190.46 | ||
| Illegal Mining, Logging, and Hunting : | $1,355,921,637,221.28 | ||
| Basic Necessitites : | $2,966,078,581,421.56 | ||
| School Loan Fraud : | $2,288,117,762,810.92 | ||
| Tax Evasion + Barter Trade : | $28,334,854,643,784.44 | ||
| Port Jackson Shark Total Market Statistics ? | |||
| National Currency: | Apexia | ||
| Exchange Rates: | 1 Apexia = $0.29 | ||
| $1 = 3.42 Apexias | |||
| Regional Exchange Rates | |||
| Gross Domestic Product: | $23,946,100,000,000.00 - 27% | ||
| Black & Grey Markets Combined: | $65,895,010,799,498.70 - 73% | ||
| Real Total Economy: | $89,841,110,799,498.70 | ||
| Safari Economic Statistics & Links | |||
| Gross Regional Product: | $13,557,557,117,321,216 | ||
| Region Wide Imports: | $1,872,219,596,652,544 | ||
| Largest Regional GDP: | Apexiala Wildlife Reserve | ||
| Largest Regional Importer: | Apexiala Wildlife Reserve | ||
| Regional Search Functions: | All Safari Nations. | ||
| Regional Nations by GDP | Regional Trading Leaders | |||
| Regional Exchange Rates | WA Members | |||
| Returns to standard Version: | FAQ | About | About | 632,432,663 uses since September 1, 2011. | |
Version 3.69 HTML4. V 0.7 is HTML1. |
Like our Calculator? Tell your friends for us... |