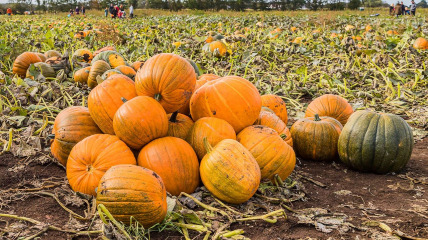
The Patch of Pumpkins 1
If you're giving in, then you're giving up
Region: No Farm No Fowl
Quicksearch Query: Pumpkins 1
|
Quicksearch: | |
NS Economy Mobile Home |
Regions Search |
Pumpkins 1 NS Page |
|
| GDP Leaders | Export Leaders | Interesting Places BIG Populations | Most Worked | | Militaristic States | Police States | |

If you're giving in, then you're giving up
Region: No Farm No Fowl
Quicksearch Query: Pumpkins 1
| Pumpkins 1 Domestic Statistics | |||
|---|---|---|---|
| Government Category: | Patch | ||
| Government Priority: | Education | ||
| Economic Rating: | Frightening | ||
| Civil Rights Rating: | Superb | ||
| Political Freedoms: | Superb | ||
| Income Tax Rate: | 84% | ||
| Consumer Confidence Rate: | 108% | ||
| Worker Enthusiasm Rate: | 110% | ||
| Major Industry: | Beef-Based Agriculture | ||
| National Animal: | mellon collie | ||
| Pumpkins 1 Demographics | |||
| Total Population: | 3,516,000,000 | ||
| Criminals: | 155,303,826 | ||
| Elderly, Disabled, & Retirees: | 273,765,713 | ||
| Military & Reserves: ? | 0 | ||
| Students and Youth: | 813,602,400 | ||
| Unemployed but Able: | 386,638,312 | ||
| Working Class: | 1,886,689,750 | ||
| Pumpkins 1 Government Budget Details | |||
| Government Budget: | $140,193,220,427,178.28 | ||
| Government Expenditures: | $137,389,356,018,634.72 | ||
| Goverment Waste: | $2,803,864,408,543.56 | ||
| Goverment Efficiency: | 98% | ||
| Pumpkins 1 Government Spending Breakdown: | |||
| Administration: | $21,982,296,962,981.55 | 16% | |
| Social Welfare: | $17,860,616,282,422.52 | 13% | |
| Healthcare: | $19,234,509,842,608.86 | 14% | |
| Education: | $23,356,190,523,167.90 | 17% | |
| Religion & Spirituality: | $0.00 | 0% | |
| Defense: | $0.00 | 0% | |
| Law & Order: | $4,121,680,680,559.04 | 3% | |
| Commerce: | $13,738,935,601,863.47 | 10% | |
| Public Transport: | $6,869,467,800,931.74 | 5% | |
| The Environment: | $12,365,042,041,677.12 | 9% | |
| Social Equality: | $9,617,254,921,304.43 | 7% | |
| Pumpkins 1White Market Economic Statistics ? | |||
| Gross Domestic Product: | $112,816,000,000,000.00 | ||
| GDP Per Capita: | $32,086.46 | ||
| Average Salary Per Employee: | $46,174.27 | ||
| Unemployment Rate: | 4.18% | ||
| Consumption: | $23,463,545,924,485.12 | ||
| Exports: | $18,681,710,108,672.00 | ||
| Imports: | $18,618,618,216,448.00 | ||
| Trade Net: | 63,091,892,224.00 | ||
| Pumpkins 1 Non Market Statistics ? Evasion, Black Market, Barter & Crime | |||
| Black & Grey Markets Combined: | $189,353,793,144,649.75 | ||
| Avg Annual Criminal's Income / Savings: ? | $80,003.11 | ||
| Recovered Product + Fines & Fees: | $4,260,460,345,754.62 | ||
| Black Market & Non Monetary Trade: | |||
| Guns & Weapons: | $0.00 | ||
| Drugs and Pharmaceuticals: | $11,869,109,965,729.15 | ||
| Extortion & Blackmail: | $13,715,415,960,398.13 | ||
| Counterfeit Goods: | $6,857,707,980,199.07 | ||
| Trafficking & Intl Sales: | $5,011,401,985,530.09 | ||
| Theft & Disappearance: | $11,077,835,968,013.87 | ||
| Counterfeit Currency & Instruments : | $10,022,803,971,060.17 | ||
| Illegal Mining, Logging, and Hunting : | $6,066,433,982,483.79 | ||
| Basic Necessitites : | $13,187,899,961,921.28 | ||
| School Loan Fraud : | $11,341,593,967,252.30 | ||
| Tax Evasion + Barter Trade : | $81,422,131,052,199.39 | ||
| Pumpkins 1 Total Market Statistics ? | |||
| National Currency: | jack-o-lantern | ||
| Exchange Rates: | 1 jack-o-lantern = $1.67 | ||
| $1 = 0.60 jack-o-lanterns | |||
| Regional Exchange Rates | |||
| Gross Domestic Product: | $112,816,000,000,000.00 - 37% | ||
| Black & Grey Markets Combined: | $189,353,793,144,649.75 - 63% | ||
| Real Total Economy: | $302,169,793,144,649.75 | ||
| No Farm No Fowl Economic Statistics & Links | |||
| Gross Regional Product: | $10,560,965,951,094,784 | ||
| Region Wide Imports: | $1,345,385,083,699,200 | ||
| Largest Regional GDP: | Beets 2 | ||
| Largest Regional Importer: | Beets 2 | ||
| Regional Search Functions: | All No Farm No Fowl Nations. | ||
| Regional Nations by GDP | Regional Trading Leaders | |||
| Regional Exchange Rates | WA Members | |||
| Returns to standard Version: | FAQ | About | About | 588,390,724 uses since September 1, 2011. | |
Version 3.69 HTML4. V 0.7 is HTML1. |
Like our Calculator? Tell your friends for us... |