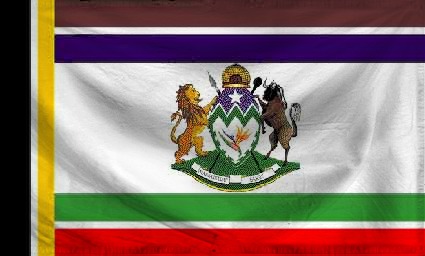
The Zulu Queendom of Queen Silomo
Ngizokushaya Wena
Region: Africa
Quicksearch Query: Queen Silomo
|
Quicksearch: | |
NS Economy Mobile Home |
Regions Search |
Queen Silomo NS Page |
|
| GDP Leaders | Export Leaders | Interesting Places BIG Populations | Most Worked | | Militaristic States | Police States | |
| Queen Silomo Domestic Statistics | |||
|---|---|---|---|
| Government Category: | Zulu Queendom | ||
| Government Priority: | Defence | ||
| Economic Rating: | Strong | ||
| Civil Rights Rating: | Frightening | ||
| Political Freedoms: | Corrupted | ||
| Income Tax Rate: | 6% | ||
| Consumer Confidence Rate: | 99% | ||
| Worker Enthusiasm Rate: | 101% | ||
| Major Industry: | Retail | ||
| National Animal: | Leopard | ||
| Queen Silomo Demographics | |||
| Total Population: | 17,633,000,000 | ||
| Criminals: | 2,270,764,775 | ||
| Elderly, Disabled, & Retirees: | 2,256,278,057 | ||
| Military & Reserves: ? | 1,244,380,758 | ||
| Students and Youth: | 2,884,758,800 | ||
| Unemployed but Able: | 2,814,170,044 | ||
| Working Class: | 6,162,647,566 | ||
| Queen Silomo Government Budget Details | |||
| Government Budget: | $27,618,188,437,592.47 | ||
| Government Expenditures: | $23,475,460,171,953.60 | ||
| Goverment Waste: | $4,142,728,265,638.87 | ||
| Goverment Efficiency: | 85% | ||
| Queen Silomo Government Spending Breakdown: | |||
| Administration: | $2,817,055,220,634.43 | 12% | |
| Social Welfare: | $3,756,073,627,512.58 | 16% | |
| Healthcare: | $3,756,073,627,512.58 | 16% | |
| Education: | $2,817,055,220,634.43 | 12% | |
| Religion & Spirituality: | $0.00 | 0% | |
| Defense: | $6,573,128,848,147.01 | 28% | |
| Law & Order: | $939,018,406,878.14 | 4% | |
| Commerce: | $0.00 | 0% | |
| Public Transport: | $2,817,055,220,634.43 | 12% | |
| The Environment: | $0.00 | 0% | |
| Social Equality: | $0.00 | 0% | |
| Queen SilomoWhite Market Economic Statistics ? | |||
| Gross Domestic Product: | $19,959,300,000,000.00 | ||
| GDP Per Capita: | $1,131.93 | ||
| Average Salary Per Employee: | $2,104.98 | ||
| Unemployment Rate: | 24.99% | ||
| Consumption: | $165,766,443,491,655.66 | ||
| Exports: | $22,494,247,256,064.00 | ||
| Imports: | $23,894,259,924,992.00 | ||
| Trade Net: | -1,400,012,668,928.00 | ||
| Queen Silomo Non Market Statistics ? Evasion, Black Market, Barter & Crime | |||
| Black & Grey Markets Combined: | $37,555,897,166,532.52 | ||
| Avg Annual Criminal's Income / Savings: ? | $1,406.37 | ||
| Recovered Product + Fines & Fees: | $1,126,676,914,995.98 | ||
| Black Market & Non Monetary Trade: | |||
| Guns & Weapons: | $2,907,051,776,072.62 | ||
| Drugs and Pharmaceuticals: | $2,284,112,109,771.34 | ||
| Extortion & Blackmail: | $1,245,879,332,602.55 | ||
| Counterfeit Goods: | $1,868,818,998,903.82 | ||
| Trafficking & Intl Sales: | $1,245,879,332,602.55 | ||
| Theft & Disappearance: | $1,661,172,443,470.07 | ||
| Counterfeit Currency & Instruments : | $3,114,698,331,506.37 | ||
| Illegal Mining, Logging, and Hunting : | $622,939,666,301.28 | ||
| Basic Necessitites : | $2,284,112,109,771.34 | ||
| School Loan Fraud : | $1,245,879,332,602.55 | ||
| Tax Evasion + Barter Trade : | $16,149,035,781,608.98 | ||
| Queen Silomo Total Market Statistics ? | |||
| National Currency: | Rand | ||
| Exchange Rates: | 1 Rand = $0.17 | ||
| $1 = 5.97 Rands | |||
| Regional Exchange Rates | |||
| Gross Domestic Product: | $19,959,300,000,000.00 - 35% | ||
| Black & Grey Markets Combined: | $37,555,897,166,532.52 - 65% | ||
| Real Total Economy: | $57,515,197,166,532.52 | ||
| Africa Economic Statistics & Links | |||
| Gross Regional Product: | $23,791,610,558,939,136 | ||
| Region Wide Imports: | $3,034,775,304,536,064 | ||
| Largest Regional GDP: | Gambia | ||
| Largest Regional Importer: | Congo | ||
| Regional Search Functions: | All Africa Nations. | ||
| Regional Nations by GDP | Regional Trading Leaders | |||
| Regional Exchange Rates | WA Members | |||
| Returns to standard Version: | FAQ | About | About | 596,709,407 uses since September 1, 2011. | |
Version 3.69 HTML4. V 0.7 is HTML1. |
Like our Calculator? Tell your friends for us... |