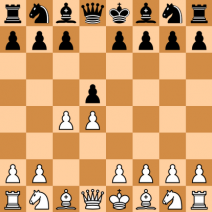
The Republic of Queens Gambit
Chess Openings
Region: Giovanniland
Quicksearch Query: Queens Gambit
|
Quicksearch: | |
NS Economy Mobile Home |
Regions Search |
Queens Gambit NS Page |
|
| GDP Leaders | Export Leaders | Interesting Places BIG Populations | Most Worked | | Militaristic States | Police States | |
| Queens Gambit Domestic Statistics | |||
|---|---|---|---|
| Government Category: | Republic | ||
| Government Priority: | Defence | ||
| Economic Rating: | Frightening | ||
| Civil Rights Rating: | Some | ||
| Political Freedoms: | Below Average | ||
| Income Tax Rate: | 70% | ||
| Consumer Confidence Rate: | 102% | ||
| Worker Enthusiasm Rate: | 102% | ||
| Major Industry: | Arms Manufacturing | ||
| National Animal: | king | ||
| Queens Gambit Demographics | |||
| Total Population: | 9,121,000,000 | ||
| Criminals: | 541,071,943 | ||
| Elderly, Disabled, & Retirees: | 928,736,687 | ||
| Military & Reserves: ? | 562,132,153 | ||
| Students and Youth: | 1,874,365,500 | ||
| Unemployed but Able: | 1,092,391,259 | ||
| Working Class: | 4,122,302,458 | ||
| Queens Gambit Government Budget Details | |||
| Government Budget: | $261,814,091,650,170.84 | ||
| Government Expenditures: | $248,723,387,067,662.28 | ||
| Goverment Waste: | $13,090,704,582,508.56 | ||
| Goverment Efficiency: | 95% | ||
| Queens Gambit Government Spending Breakdown: | |||
| Administration: | $37,308,508,060,149.34 | 15% | |
| Social Welfare: | $17,410,637,094,736.36 | 7% | |
| Healthcare: | $14,923,403,224,059.74 | 6% | |
| Education: | $32,334,040,318,796.10 | 13% | |
| Religion & Spirituality: | $2,487,233,870,676.62 | 1% | |
| Defense: | $49,744,677,413,532.46 | 20% | |
| Law & Order: | $44,770,209,672,179.21 | 18% | |
| Commerce: | $24,872,338,706,766.23 | 10% | |
| Public Transport: | $7,461,701,612,029.87 | 3% | |
| The Environment: | $9,948,935,482,706.49 | 4% | |
| Social Equality: | $12,436,169,353,383.12 | 5% | |
| Queens GambitWhite Market Economic Statistics ? | |||
| Gross Domestic Product: | $201,346,000,000,000.00 | ||
| GDP Per Capita: | $22,074.99 | ||
| Average Salary Per Employee: | $33,030.63 | ||
| Unemployment Rate: | 8.29% | ||
| Consumption: | $99,913,153,118,208.00 | ||
| Exports: | $41,976,296,374,272.00 | ||
| Imports: | $42,727,643,283,456.00 | ||
| Trade Net: | -751,346,909,184.00 | ||
| Queens Gambit Non Market Statistics ? Evasion, Black Market, Barter & Crime | |||
| Black & Grey Markets Combined: | $714,821,880,329,120.00 | ||
| Avg Annual Criminal's Income / Savings: ? | $119,666.82 | ||
| Recovered Product + Fines & Fees: | $96,500,953,844,431.20 | ||
| Black Market & Non Monetary Trade: | |||
| Guns & Weapons: | $35,684,846,469,747.60 | ||
| Drugs and Pharmaceuticals: | $22,908,790,326,257.72 | ||
| Extortion & Blackmail: | $44,055,366,012,034.07 | ||
| Counterfeit Goods: | $66,964,156,338,291.78 | ||
| Trafficking & Intl Sales: | $9,692,180,522,647.50 | ||
| Theft & Disappearance: | $19,384,361,045,294.99 | ||
| Counterfeit Currency & Instruments : | $75,775,229,540,698.59 | ||
| Illegal Mining, Logging, and Hunting : | $9,692,180,522,647.50 | ||
| Basic Necessitites : | $28,195,434,247,701.80 | ||
| School Loan Fraud : | $26,433,219,607,220.44 | ||
| Tax Evasion + Barter Trade : | $307,373,408,541,521.62 | ||
| Queens Gambit Total Market Statistics ? | |||
| National Currency: | pawn | ||
| Exchange Rates: | 1 pawn = $1.38 | ||
| $1 = 0.72 pawns | |||
| Regional Exchange Rates | |||
| Gross Domestic Product: | $201,346,000,000,000.00 - 22% | ||
| Black & Grey Markets Combined: | $714,821,880,329,120.00 - 78% | ||
| Real Total Economy: | $916,167,880,329,120.00 | ||
| Giovanniland Economic Statistics & Links | |||
| Gross Regional Product: | $185,450,760,786,411,520 | ||
| Region Wide Imports: | $23,373,907,809,533,952 | ||
| Largest Regional GDP: | GiovanniCards | ||
| Largest Regional Importer: | GiovanniCards | ||
| Regional Search Functions: | All Giovanniland Nations. | ||
| Regional Nations by GDP | Regional Trading Leaders | |||
| Regional Exchange Rates | WA Members | |||
| Returns to standard Version: | FAQ | About | About | 588,810,425 uses since September 1, 2011. | |
Version 3.69 HTML4. V 0.7 is HTML1. |
Like our Calculator? Tell your friends for us... |