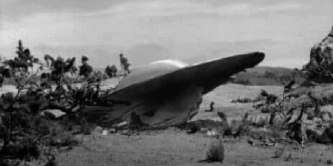
The Nomadic Peoples of Roswell NM
Its a Weather Balloon, can't you tell?
Region: New Mexico
Quicksearch Query: Roswell NM
|
Quicksearch: | |
NS Economy Mobile Home |
Regions Search |
Roswell NM NS Page |
|
| GDP Leaders | Export Leaders | Interesting Places BIG Populations | Most Worked | | Militaristic States | Police States | |

Its a Weather Balloon, can't you tell?
Region: New Mexico
Quicksearch Query: Roswell NM
| Roswell NM Domestic Statistics | |||
|---|---|---|---|
| Government Category: | Nomadic Peoples | ||
| Government Priority: | Healthcare | ||
| Economic Rating: | Strong | ||
| Civil Rights Rating: | Frightening | ||
| Political Freedoms: | Corrupted | ||
| Income Tax Rate: | 17% | ||
| Consumer Confidence Rate: | 99% | ||
| Worker Enthusiasm Rate: | 101% | ||
| Major Industry: | Soda Sales | ||
| National Animal: | selat | ||
| Roswell NM Demographics | |||
| Total Population: | 28,317,000,000 | ||
| Criminals: | 3,566,944,195 | ||
| Elderly, Disabled, & Retirees: | 3,519,903,365 | ||
| Military & Reserves: ? | 648,772,900 | ||
| Students and Youth: | 4,747,345,050 | ||
| Unemployed but Able: | 4,468,494,424 | ||
| Working Class: | 11,365,540,066 | ||
| Roswell NM Government Budget Details | |||
| Government Budget: | $70,859,347,569,986.77 | ||
| Government Expenditures: | $60,230,445,434,488.75 | ||
| Goverment Waste: | $10,628,902,135,498.02 | ||
| Goverment Efficiency: | 85% | ||
| Roswell NM Government Spending Breakdown: | |||
| Administration: | $5,420,740,089,103.99 | 9% | |
| Social Welfare: | $5,420,740,089,103.99 | 9% | |
| Healthcare: | $6,023,044,543,448.88 | 10% | |
| Education: | $5,420,740,089,103.99 | 9% | |
| Religion & Spirituality: | $5,420,740,089,103.99 | 9% | |
| Defense: | $5,420,740,089,103.99 | 9% | |
| Law & Order: | $3,011,522,271,724.44 | 5% | |
| Commerce: | $5,420,740,089,103.99 | 9% | |
| Public Transport: | $5,420,740,089,103.99 | 9% | |
| The Environment: | $5,420,740,089,103.99 | 9% | |
| Social Equality: | $5,420,740,089,103.99 | 9% | |
| Roswell NMWhite Market Economic Statistics ? | |||
| Gross Domestic Product: | $52,336,600,000,000.00 | ||
| GDP Per Capita: | $1,848.24 | ||
| Average Salary Per Employee: | $2,992.85 | ||
| Unemployment Rate: | 24.24% | ||
| Consumption: | $235,147,217,684,398.06 | ||
| Exports: | $39,034,285,064,192.00 | ||
| Imports: | $37,295,545,647,104.00 | ||
| Trade Net: | 1,738,739,417,088.00 | ||
| Roswell NM Non Market Statistics ? Evasion, Black Market, Barter & Crime | |||
| Black & Grey Markets Combined: | $162,721,585,736,059.88 | ||
| Avg Annual Criminal's Income / Savings: ? | $3,277.25 | ||
| Recovered Product + Fines & Fees: | $6,102,059,465,102.25 | ||
| Black Market & Non Monetary Trade: | |||
| Guns & Weapons: | $5,021,613,561,062.58 | ||
| Drugs and Pharmaceuticals: | $8,480,947,347,572.36 | ||
| Extortion & Blackmail: | $8,034,581,697,700.13 | ||
| Counterfeit Goods: | $8,257,764,522,636.24 | ||
| Trafficking & Intl Sales: | $8,034,581,697,700.13 | ||
| Theft & Disappearance: | $8,480,947,347,572.36 | ||
| Counterfeit Currency & Instruments : | $8,257,764,522,636.24 | ||
| Illegal Mining, Logging, and Hunting : | $6,025,936,273,275.10 | ||
| Basic Necessitites : | $8,034,581,697,700.13 | ||
| School Loan Fraud : | $6,025,936,273,275.10 | ||
| Tax Evasion + Barter Trade : | $69,970,281,866,505.74 | ||
| Roswell NM Total Market Statistics ? | |||
| National Currency: | debris | ||
| Exchange Rates: | 1 debris = $0.21 | ||
| $1 = 4.68 debriss | |||
| Regional Exchange Rates | |||
| Gross Domestic Product: | $52,336,600,000,000.00 - 24% | ||
| Black & Grey Markets Combined: | $162,721,585,736,059.88 - 76% | ||
| Real Total Economy: | $215,058,185,736,059.88 | ||
| New Mexico Economic Statistics & Links | |||
| Gross Regional Product: | $2,055,310,294,384,640 | ||
| Region Wide Imports: | $283,179,541,856,256 | ||
| Largest Regional GDP: | Corbin Good | ||
| Largest Regional Importer: | Corbin Good | ||
| Regional Search Functions: | All New Mexico Nations. | ||
| Regional Nations by GDP | Regional Trading Leaders | |||
| Regional Exchange Rates | WA Members | |||
| Returns to standard Version: | FAQ | About | About | 598,322,536 uses since September 1, 2011. | |
Version 3.69 HTML4. V 0.7 is HTML1. |
Like our Calculator? Tell your friends for us... |