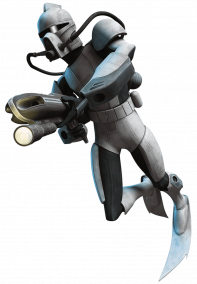
The Republic of SCUBA Trooper 3
FOR THE ARMADA!!
Region: Tamil Eelam
Quicksearch Query: SCUBA Trooper 3
|
Quicksearch: | |
NS Economy Mobile Home |
Regions Search |
SCUBA Trooper 3 NS Page |
|
| GDP Leaders | Export Leaders | Interesting Places BIG Populations | Most Worked | | Militaristic States | Police States | |
FOR THE ARMADA!!
Region: Tamil Eelam
Quicksearch Query: SCUBA Trooper 3
| SCUBA Trooper 3 Domestic Statistics | |||
|---|---|---|---|
| Government Category: | Republic | ||
| Government Priority: | Defence | ||
| Economic Rating: | Good | ||
| Civil Rights Rating: | Some | ||
| Political Freedoms: | Average | ||
| Income Tax Rate: | 36% | ||
| Consumer Confidence Rate: | 98% | ||
| Worker Enthusiasm Rate: | 100% | ||
| Major Industry: | Pizza Delivery | ||
| National Animal: | Droid | ||
| SCUBA Trooper 3 Demographics | |||
| Total Population: | 1,680,000,000 | ||
| Criminals: | 182,479,229 | ||
| Elderly, Disabled, & Retirees: | 212,810,196 | ||
| Military & Reserves: ? | 73,548,276 | ||
| Students and Youth: | 302,064,000 | ||
| Unemployed but Able: | 261,585,045 | ||
| Working Class: | 647,513,254 | ||
| SCUBA Trooper 3 Government Budget Details | |||
| Government Budget: | $5,733,536,457,566.45 | ||
| Government Expenditures: | $5,504,194,999,263.80 | ||
| Goverment Waste: | $229,341,458,302.66 | ||
| Goverment Efficiency: | 96% | ||
| SCUBA Trooper 3 Government Spending Breakdown: | |||
| Administration: | $605,461,449,919.02 | 11% | |
| Social Welfare: | $770,587,299,896.93 | 14% | |
| Healthcare: | $440,335,599,941.10 | 8% | |
| Education: | $605,461,449,919.02 | 11% | |
| Religion & Spirituality: | $165,125,849,977.91 | 3% | |
| Defense: | $935,713,149,874.85 | 17% | |
| Law & Order: | $770,587,299,896.93 | 14% | |
| Commerce: | $385,293,649,948.47 | 7% | |
| Public Transport: | $385,293,649,948.47 | 7% | |
| The Environment: | $165,125,849,977.91 | 3% | |
| Social Equality: | $165,125,849,977.91 | 3% | |
| SCUBA Trooper 3White Market Economic Statistics ? | |||
| Gross Domestic Product: | $4,538,380,000,000.00 | ||
| GDP Per Capita: | $2,701.42 | ||
| Average Salary Per Employee: | $4,464.69 | ||
| Unemployment Rate: | 23.36% | ||
| Consumption: | $7,913,783,930,388.48 | ||
| Exports: | $1,636,016,021,504.00 | ||
| Imports: | $1,711,527,690,240.00 | ||
| Trade Net: | -75,511,668,736.00 | ||
| SCUBA Trooper 3 Non Market Statistics ? Evasion, Black Market, Barter & Crime | |||
| Black & Grey Markets Combined: | $13,856,392,869,048.13 | ||
| Avg Annual Criminal's Income / Savings: ? | $6,391.76 | ||
| Recovered Product + Fines & Fees: | $1,454,921,251,250.05 | ||
| Black Market & Non Monetary Trade: | |||
| Guns & Weapons: | $627,359,445,465.36 | ||
| Drugs and Pharmaceuticals: | $530,162,911,660.87 | ||
| Extortion & Blackmail: | $636,195,493,993.04 | ||
| Counterfeit Goods: | $1,042,653,726,266.37 | ||
| Trafficking & Intl Sales: | $353,441,941,107.25 | ||
| Theft & Disappearance: | $388,786,135,217.97 | ||
| Counterfeit Currency & Instruments : | $1,184,030,502,709.27 | ||
| Illegal Mining, Logging, and Hunting : | $229,737,261,719.71 | ||
| Basic Necessitites : | $742,228,076,325.22 | ||
| School Loan Fraud : | $441,802,426,384.06 | ||
| Tax Evasion + Barter Trade : | $5,958,248,933,690.70 | ||
| SCUBA Trooper 3 Total Market Statistics ? | |||
| National Currency: | Credit | ||
| Exchange Rates: | 1 Credit = $0.22 | ||
| $1 = 4.47 Credits | |||
| Regional Exchange Rates | |||
| Gross Domestic Product: | $4,538,380,000,000.00 - 25% | ||
| Black & Grey Markets Combined: | $13,856,392,869,048.13 - 75% | ||
| Real Total Economy: | $18,394,772,869,048.13 | ||
| Tamil Eelam Economic Statistics & Links | |||
| Gross Regional Product: | $3,100,855,255,433,216 | ||
| Region Wide Imports: | $410,265,342,443,520 | ||
| Largest Regional GDP: | Jewish Monaco | ||
| Largest Regional Importer: | Jewish Monaco | ||
| Regional Search Functions: | All Tamil Eelam Nations. | ||
| Regional Nations by GDP | Regional Trading Leaders | |||
| Regional Exchange Rates | WA Members | |||
| Returns to standard Version: | FAQ | About | About | 677,809,447 uses since September 1, 2011. | |
Version 3.69 HTML4. V 0.7 is HTML1. |
Like our Calculator? Tell your friends for us... |