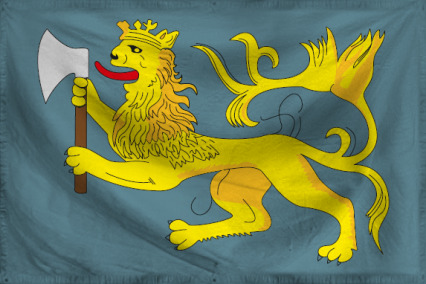
The Patrimonium of Saint Olav
Slaughter is the only means to a new beginning
Region: Agora
Quicksearch Query: Saint Olav
|
Quicksearch: | |
NS Economy Mobile Home |
Regions Search |
Saint Olav NS Page |
|
| GDP Leaders | Export Leaders | Interesting Places BIG Populations | Most Worked | | Militaristic States | Police States | |

Slaughter is the only means to a new beginning
Region: Agora
Quicksearch Query: Saint Olav
| Saint Olav Domestic Statistics | |||
|---|---|---|---|
| Government Category: | Patrimonium | ||
| Government Priority: | Education | ||
| Economic Rating: | Frightening | ||
| Civil Rights Rating: | Superb | ||
| Political Freedoms: | Some | ||
| Income Tax Rate: | 93% | ||
| Consumer Confidence Rate: | 108% | ||
| Worker Enthusiasm Rate: | 107% | ||
| Major Industry: | Tourism | ||
| National Animal: | Crowned Lion | ||
| Saint Olav Demographics | |||
| Total Population: | 21,234,000,000 | ||
| Criminals: | 1,001,337,819 | ||
| Elderly, Disabled, & Retirees: | 1,449,820,557 | ||
| Military & Reserves: ? | 817,579,855 | ||
| Students and Youth: | 5,075,987,700 | ||
| Unemployed but Able: | 2,351,578,163 | ||
| Working Class: | 10,537,695,906 | ||
| Saint Olav Government Budget Details | |||
| Government Budget: | $862,625,941,979,754.62 | ||
| Government Expenditures: | $810,868,385,460,969.25 | ||
| Goverment Waste: | $51,757,556,518,785.38 | ||
| Goverment Efficiency: | 94% | ||
| Saint Olav Government Spending Breakdown: | |||
| Administration: | $40,543,419,273,048.46 | 5% | |
| Social Welfare: | $72,978,154,691,487.23 | 9% | |
| Healthcare: | $137,847,625,528,364.78 | 17% | |
| Education: | $137,847,625,528,364.78 | 17% | |
| Religion & Spirituality: | $0.00 | 0% | |
| Defense: | $97,304,206,255,316.31 | 12% | |
| Law & Order: | $48,652,103,127,658.16 | 6% | |
| Commerce: | $81,086,838,546,096.92 | 10% | |
| Public Transport: | $40,543,419,273,048.46 | 5% | |
| The Environment: | $72,978,154,691,487.23 | 9% | |
| Social Equality: | $40,543,419,273,048.46 | 5% | |
| Saint OlavWhite Market Economic Statistics ? | |||
| Gross Domestic Product: | $658,085,000,000,000.00 | ||
| GDP Per Capita: | $30,992.04 | ||
| Average Salary Per Employee: | $46,909.11 | ||
| Unemployment Rate: | 4.51% | ||
| Consumption: | $60,331,629,079,429.12 | ||
| Exports: | $108,367,805,677,568.00 | ||
| Imports: | $100,841,704,914,944.00 | ||
| Trade Net: | 7,526,100,762,624.00 | ||
| Saint Olav Non Market Statistics ? Evasion, Black Market, Barter & Crime | |||
| Black & Grey Markets Combined: | $1,293,137,227,610,585.50 | ||
| Avg Annual Criminal's Income / Savings: ? | $96,087.02 | ||
| Recovered Product + Fines & Fees: | $58,191,175,242,476.34 | ||
| Black Market & Non Monetary Trade: | |||
| Guns & Weapons: | $42,235,154,990,989.33 | ||
| Drugs and Pharmaceuticals: | $89,749,704,355,852.34 | ||
| Extortion & Blackmail: | $52,793,943,738,736.66 | ||
| Counterfeit Goods: | $77,431,117,483,480.44 | ||
| Trafficking & Intl Sales: | $33,436,164,367,866.55 | ||
| Theft & Disappearance: | $77,431,117,483,480.44 | ||
| Counterfeit Currency & Instruments : | $59,833,136,237,234.89 | ||
| Illegal Mining, Logging, and Hunting : | $40,475,356,866,364.77 | ||
| Basic Necessitites : | $70,391,924,984,982.23 | ||
| School Loan Fraud : | $75,671,319,358,855.89 | ||
| Tax Evasion + Barter Trade : | $556,049,007,872,551.75 | ||
| Saint Olav Total Market Statistics ? | |||
| National Currency: | Penning | ||
| Exchange Rates: | 1 Penning = $1.64 | ||
| $1 = 0.61 Pennings | |||
| Regional Exchange Rates | |||
| Gross Domestic Product: | $658,085,000,000,000.00 - 34% | ||
| Black & Grey Markets Combined: | $1,293,137,227,610,585.50 - 66% | ||
| Real Total Economy: | $1,951,222,227,610,585.50 | ||
| Agora Economic Statistics & Links | |||
| Gross Regional Product: | $2,709,154,774,908,928 | ||
| Region Wide Imports: | $340,633,285,820,416 | ||
| Largest Regional GDP: | Coloran | ||
| Largest Regional Importer: | Coloran | ||
| Regional Search Functions: | All Agora Nations. | ||
| Regional Nations by GDP | Regional Trading Leaders | |||
| Regional Exchange Rates | WA Members | |||
| Returns to standard Version: | FAQ | About | About | 589,384,273 uses since September 1, 2011. | |
Version 3.69 HTML4. V 0.7 is HTML1. |
Like our Calculator? Tell your friends for us... |