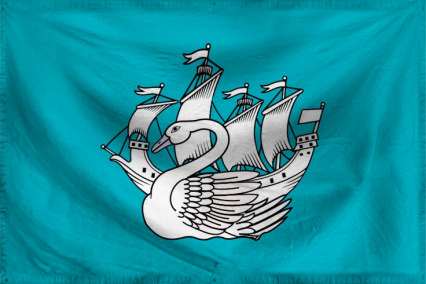
The Dominion of Silver Swan
For Gondor!
Region: Bree
Quicksearch Query: Silver Swan
|
Quicksearch: | |
NS Economy Mobile Home |
Regions Search |
Silver Swan NS Page |
|
| GDP Leaders | Export Leaders | Interesting Places BIG Populations | Most Worked | | Militaristic States | Police States | |
| Silver Swan Domestic Statistics | |||
|---|---|---|---|
| Government Category: | Dominion | ||
| Government Priority: | Defence | ||
| Economic Rating: | Strong | ||
| Civil Rights Rating: | Frightening | ||
| Political Freedoms: | Corrupted | ||
| Income Tax Rate: | 7% | ||
| Consumer Confidence Rate: | 99% | ||
| Worker Enthusiasm Rate: | 101% | ||
| Major Industry: | Door-to-door Insurance Sales | ||
| National Animal: | swan | ||
| Silver Swan Demographics | |||
| Total Population: | 5,996,000,000 | ||
| Criminals: | 771,036,437 | ||
| Elderly, Disabled, & Retirees: | 763,794,836 | ||
| Military & Reserves: ? | 408,304,767 | ||
| Students and Youth: | 984,543,200 | ||
| Unemployed but Able: | 956,225,728 | ||
| Working Class: | 2,112,095,032 | ||
| Silver Swan Government Budget Details | |||
| Government Budget: | $9,901,115,735,330.00 | ||
| Government Expenditures: | $8,415,948,375,030.50 | ||
| Goverment Waste: | $1,485,167,360,299.50 | ||
| Goverment Efficiency: | 85% | ||
| Silver Swan Government Spending Breakdown: | |||
| Administration: | $1,009,913,805,003.66 | 12% | |
| Social Welfare: | $1,262,392,256,254.57 | 15% | |
| Healthcare: | $1,599,030,191,255.79 | 19% | |
| Education: | $1,009,913,805,003.66 | 12% | |
| Religion & Spirituality: | $0.00 | 0% | |
| Defense: | $2,272,306,061,258.24 | 27% | |
| Law & Order: | $336,637,935,001.22 | 4% | |
| Commerce: | $0.00 | 0% | |
| Public Transport: | $1,009,913,805,003.66 | 12% | |
| The Environment: | $0.00 | 0% | |
| Social Equality: | $0.00 | 0% | |
| Silver SwanWhite Market Economic Statistics ? | |||
| Gross Domestic Product: | $7,070,860,000,000.00 | ||
| GDP Per Capita: | $1,179.26 | ||
| Average Salary Per Employee: | $2,175.85 | ||
| Unemployment Rate: | 24.94% | ||
| Consumption: | $55,768,264,873,082.88 | ||
| Exports: | $7,598,530,887,680.00 | ||
| Imports: | $8,104,094,728,192.00 | ||
| Trade Net: | -505,563,840,512.00 | ||
| Silver Swan Non Market Statistics ? Evasion, Black Market, Barter & Crime | |||
| Black & Grey Markets Combined: | $14,740,782,100,930.41 | ||
| Avg Annual Criminal's Income / Savings: ? | $1,609.27 | ||
| Recovered Product + Fines & Fees: | $442,223,463,027.91 | ||
| Black Market & Non Monetary Trade: | |||
| Guns & Weapons: | $1,100,274,087,186.60 | ||
| Drugs and Pharmaceuticals: | $1,018,772,302,950.55 | ||
| Extortion & Blackmail: | $489,010,705,416.27 | ||
| Counterfeit Goods: | $713,140,612,065.39 | ||
| Trafficking & Intl Sales: | $489,010,705,416.27 | ||
| Theft & Disappearance: | $774,266,950,242.42 | ||
| Counterfeit Currency & Instruments : | $1,202,151,317,481.65 | ||
| Illegal Mining, Logging, and Hunting : | $244,505,352,708.13 | ||
| Basic Necessitites : | $855,768,734,478.46 | ||
| School Loan Fraud : | $489,010,705,416.27 | ||
| Tax Evasion + Barter Trade : | $6,338,536,303,400.07 | ||
| Silver Swan Total Market Statistics ? | |||
| National Currency: | denier | ||
| Exchange Rates: | 1 denier = $0.17 | ||
| $1 = 5.85 deniers | |||
| Regional Exchange Rates | |||
| Gross Domestic Product: | $7,070,860,000,000.00 - 32% | ||
| Black & Grey Markets Combined: | $14,740,782,100,930.41 - 68% | ||
| Real Total Economy: | $21,811,642,100,930.41 | ||
| Bree Economic Statistics & Links | |||
| Gross Regional Product: | $2,480,359,451,131,904 | ||
| Region Wide Imports: | $314,296,881,905,664 | ||
| Largest Regional GDP: | Torpidity | ||
| Largest Regional Importer: | Torpidity | ||
| Regional Search Functions: | All Bree Nations. | ||
| Regional Nations by GDP | Regional Trading Leaders | |||
| Regional Exchange Rates | WA Members | |||
| Returns to standard Version: | FAQ | About | About | 589,338,703 uses since September 1, 2011. | |
Version 3.69 HTML4. V 0.7 is HTML1. |
Like our Calculator? Tell your friends for us... |