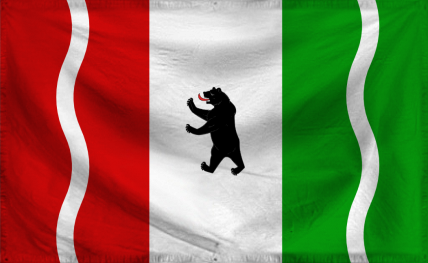
The Kingdom of South Baltic
Pride and Industry
Region: the South Pacific
Quicksearch Query: South Baltic
|
Quicksearch: | |
NS Economy Mobile Home |
Regions Search |
South Baltic NS Page |
|
| GDP Leaders | Export Leaders | Interesting Places BIG Populations | Most Worked | | Militaristic States | Police States | |

Pride and Industry
Region: the South Pacific
Quicksearch Query: South Baltic
| South Baltic Domestic Statistics | |||
|---|---|---|---|
| Government Category: | Kingdom | ||
| Government Priority: | Religion & Spirituality | ||
| Economic Rating: | Good | ||
| Civil Rights Rating: | Few | ||
| Political Freedoms: | Rare | ||
| Income Tax Rate: | 38% | ||
| Consumer Confidence Rate: | 96% | ||
| Worker Enthusiasm Rate: | 95% | ||
| Major Industry: | Beef-Based Agriculture | ||
| National Animal: | Black Bear | ||
| South Baltic Demographics | |||
| Total Population: | 10,000,000 | ||
| Criminals: | 1,176,539 | ||
| Elderly, Disabled, & Retirees: | 1,200,699 | ||
| Military & Reserves: ? | 306,979 | ||
| Students and Youth: | 1,790,000 | ||
| Unemployed but Able: | 1,569,164 | ||
| Working Class: | 3,956,620 | ||
| South Baltic Government Budget Details | |||
| Government Budget: | $30,816,424,540.57 | ||
| Government Expenditures: | $27,734,782,086.51 | ||
| Goverment Waste: | $3,081,642,454.06 | ||
| Goverment Efficiency: | 90% | ||
| South Baltic Government Spending Breakdown: | |||
| Administration: | $1,664,086,925.19 | 6% | |
| Social Welfare: | $3,328,173,850.38 | 12% | |
| Healthcare: | $2,496,130,387.79 | 9% | |
| Education: | $2,773,478,208.65 | 10% | |
| Religion & Spirituality: | $5,546,956,417.30 | 20% | |
| Defense: | $3,328,173,850.38 | 12% | |
| Law & Order: | $3,605,521,671.25 | 13% | |
| Commerce: | $832,043,462.60 | 3% | |
| Public Transport: | $1,664,086,925.19 | 6% | |
| The Environment: | $832,043,462.60 | 3% | |
| Social Equality: | $1,109,391,283.46 | 4% | |
| South BalticWhite Market Economic Statistics ? | |||
| Gross Domestic Product: | $22,066,100,000.00 | ||
| GDP Per Capita: | $2,206.61 | ||
| Average Salary Per Employee: | $3,306.05 | ||
| Unemployment Rate: | 23.86% | ||
| Consumption: | $42,479,424,634.88 | ||
| Exports: | $8,681,237,952.00 | ||
| Imports: | $9,142,763,520.00 | ||
| Trade Net: | -461,525,568.00 | ||
| South Baltic Non Market Statistics ? Evasion, Black Market, Barter & Crime | |||
| Black & Grey Markets Combined: | $86,470,250,106.04 | ||
| Avg Annual Criminal's Income / Savings: ? | $5,832.97 | ||
| Recovered Product + Fines & Fees: | $8,430,849,385.34 | ||
| Black Market & Non Monetary Trade: | |||
| Guns & Weapons: | $3,781,008,964.92 | ||
| Drugs and Pharmaceuticals: | $5,337,895,009.30 | ||
| Extortion & Blackmail: | $2,001,710,628.49 | ||
| Counterfeit Goods: | $4,893,070,425.19 | ||
| Trafficking & Intl Sales: | $3,892,215,110.95 | ||
| Theft & Disappearance: | $2,891,359,796.70 | ||
| Counterfeit Currency & Instruments : | $5,560,307,301.35 | ||
| Illegal Mining, Logging, and Hunting : | $1,334,473,752.32 | ||
| Basic Necessitites : | $4,225,833,549.03 | ||
| School Loan Fraud : | $2,557,741,358.62 | ||
| Tax Evasion + Barter Trade : | $37,182,207,545.60 | ||
| South Baltic Total Market Statistics ? | |||
| National Currency: | Euro | ||
| Exchange Rates: | 1 Euro = $0.20 | ||
| $1 = 4.94 Euros | |||
| Regional Exchange Rates | |||
| Gross Domestic Product: | $22,066,100,000.00 - 20% | ||
| Black & Grey Markets Combined: | $86,470,250,106.04 - 80% | ||
| Real Total Economy: | $108,536,350,106.04 | ||
| the South Pacific Economic Statistics & Links | |||
| Gross Regional Product: | $364,920,865,512,488,960 | ||
| Region Wide Imports: | $46,237,401,705,611,264 | ||
| Largest Regional GDP: | United Earthlings | ||
| Largest Regional Importer: | Curlyhoward | ||
| Regional Search Functions: | All the South Pacific Nations. | ||
| Regional Nations by GDP | Regional Trading Leaders | |||
| Regional Exchange Rates | WA Members | |||
| Returns to standard Version: | FAQ | About | About | 558,226,394 uses since September 1, 2011. | |
Version 3.69 HTML4. V 0.7 is HTML1. |
Like our Calculator? Tell your friends for us... |