The Colony of Tampere sub-region
By The People For The People
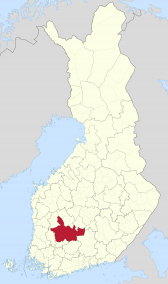
Region: Sub regions of Finland
Quicksearch Query: Tampere sub-region
|
Quicksearch: | |
NS Economy Mobile Home |
Regions Search |
Tampere sub-region NS Page |
|
| GDP Leaders | Export Leaders | Interesting Places BIG Populations | Most Worked | | Militaristic States | Police States | |
By The People For The People
Region: Sub regions of Finland
Quicksearch Query: Tampere sub-region
| Tampere sub-region Domestic Statistics | |||
|---|---|---|---|
| Government Category: | Colony | ||
| Government Priority: | Defence | ||
| Economic Rating: | Frightening | ||
| Civil Rights Rating: | Outlawed | ||
| Political Freedoms: | Few | ||
| Income Tax Rate: | 72% | ||
| Consumer Confidence Rate: | 94% | ||
| Worker Enthusiasm Rate: | 95% | ||
| Major Industry: | Arms Manufacturing | ||
| National Animal: | kangaroo | ||
| Tampere sub-region Demographics | |||
| Total Population: | 4,657,000,000 | ||
| Criminals: | 327,692,140 | ||
| Elderly, Disabled, & Retirees: | 472,932,681 | ||
| Military & Reserves: ? | 250,889,152 | ||
| Students and Youth: | 946,302,400 | ||
| Unemployed but Able: | 587,025,077 | ||
| Working Class: | 2,072,158,551 | ||
| Tampere sub-region Government Budget Details | |||
| Government Budget: | $112,513,893,205,498.92 | ||
| Government Expenditures: | $103,512,781,749,059.02 | ||
| Goverment Waste: | $9,001,111,456,439.91 | ||
| Goverment Efficiency: | 92% | ||
| Tampere sub-region Government Spending Breakdown: | |||
| Administration: | $14,491,789,444,868.26 | 14% | |
| Social Welfare: | $3,105,383,452,471.77 | 3% | |
| Healthcare: | $9,316,150,357,415.31 | 9% | |
| Education: | $12,421,533,809,887.08 | 12% | |
| Religion & Spirituality: | $0.00 | 0% | |
| Defense: | $18,632,300,714,830.62 | 18% | |
| Law & Order: | $18,632,300,714,830.62 | 18% | |
| Commerce: | $13,456,661,627,377.67 | 13% | |
| Public Transport: | $2,070,255,634,981.18 | 2% | |
| The Environment: | $6,210,766,904,943.54 | 6% | |
| Social Equality: | $4,140,511,269,962.36 | 4% | |
| Tampere sub-regionWhite Market Economic Statistics ? | |||
| Gross Domestic Product: | $82,047,900,000,000.00 | ||
| GDP Per Capita: | $17,618.19 | ||
| Average Salary Per Employee: | $22,983.14 | ||
| Unemployment Rate: | 10.92% | ||
| Consumption: | $40,875,390,989,762.56 | ||
| Exports: | $18,758,432,915,456.00 | ||
| Imports: | $19,201,704,067,072.00 | ||
| Trade Net: | -443,271,151,616.00 | ||
| Tampere sub-region Non Market Statistics ? Evasion, Black Market, Barter & Crime | |||
| Black & Grey Markets Combined: | $345,646,426,166,228.25 | ||
| Avg Annual Criminal's Income / Savings: ? | $93,509.76 | ||
| Recovered Product + Fines & Fees: | $46,662,267,532,440.82 | ||
| Black Market & Non Monetary Trade: | |||
| Guns & Weapons: | $15,337,887,337,913.29 | ||
| Drugs and Pharmaceuticals: | $12,781,572,781,594.41 | ||
| Extortion & Blackmail: | $23,006,831,006,869.94 | ||
| Counterfeit Goods: | $34,084,194,084,251.77 | ||
| Trafficking & Intl Sales: | $4,260,524,260,531.47 | ||
| Theft & Disappearance: | $11,077,363,077,381.82 | ||
| Counterfeit Currency & Instruments : | $34,936,298,936,358.06 | ||
| Illegal Mining, Logging, and Hunting : | $5,964,733,964,744.06 | ||
| Basic Necessitites : | $9,373,153,373,169.24 | ||
| School Loan Fraud : | $12,781,572,781,594.41 | ||
| Tax Evasion + Barter Trade : | $148,627,963,251,478.16 | ||
| Tampere sub-region Total Market Statistics ? | |||
| National Currency: | rupee | ||
| Exchange Rates: | 1 rupee = $1.24 | ||
| $1 = 0.81 rupees | |||
| Regional Exchange Rates | |||
| Gross Domestic Product: | $82,047,900,000,000.00 - 19% | ||
| Black & Grey Markets Combined: | $345,646,426,166,228.25 - 81% | ||
| Real Total Economy: | $427,694,326,166,228.25 | ||
| Sub regions of Finland Economic Statistics & Links | |||
| Gross Regional Product: | $11,351,398,847,348,736 | ||
| Region Wide Imports: | $1,458,619,614,756,864 | ||
| Largest Regional GDP: | Upper Savonia | ||
| Largest Regional Importer: | Upper Savonia | ||
| Regional Search Functions: | All Sub regions of Finland Nations. | ||
| Regional Nations by GDP | Regional Trading Leaders | |||
| Regional Exchange Rates | WA Members | |||
| Returns to standard Version: | FAQ | About | About | 633,212,957 uses since September 1, 2011. | |
Version 3.69 HTML4. V 0.7 is HTML1. |
Like our Calculator? Tell your friends for us... |