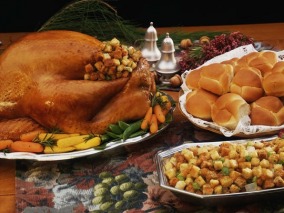
The Dining Room Full of Thanksgiving Dinner
Pass The Gravy
Region: Thanksgiving
Quicksearch Query: Thanksgiving Dinner
|
Quicksearch: | |
NS Economy Mobile Home |
Regions Search |
Thanksgiving Dinner NS Page |
|
| GDP Leaders | Export Leaders | Interesting Places BIG Populations | Most Worked | | Militaristic States | Police States | |

Pass The Gravy
Region: Thanksgiving
Quicksearch Query: Thanksgiving Dinner
| Thanksgiving Dinner Domestic Statistics | |||
|---|---|---|---|
| Government Category: | Dining Room Full | ||
| Government Priority: | Education | ||
| Economic Rating: | Frightening | ||
| Civil Rights Rating: | Very Good | ||
| Political Freedoms: | Very Good | ||
| Income Tax Rate: | 100% | ||
| Consumer Confidence Rate: | 106% | ||
| Worker Enthusiasm Rate: | 85% | ||
| Major Industry: | Information Technology | ||
| National Animal: | turkey | ||
| Thanksgiving Dinner Demographics | |||
| Total Population: | 24,275,000,000 | ||
| Criminals: | 1,223,193,355 | ||
| Elderly, Disabled, & Retirees: | 211,097,805 | ||
| Military & Reserves: ? | 153,444,278 | ||
| Students and Youth: | 7,282,500,000 | ||
| Unemployed but Able: | 2,771,185,666 | ||
| Working Class: | 12,633,578,896 | ||
| Thanksgiving Dinner Government Budget Details | |||
| Government Budget: | $837,035,868,137,560.62 | ||
| Government Expenditures: | $811,924,792,093,433.75 | ||
| Goverment Waste: | $25,111,076,044,126.88 | ||
| Goverment Efficiency: | 97% | ||
| Thanksgiving Dinner Government Spending Breakdown: | |||
| Administration: | $48,715,487,525,606.02 | 6% | |
| Social Welfare: | $16,238,495,841,868.68 | 2% | |
| Healthcare: | $97,430,975,051,212.05 | 12% | |
| Education: | $227,338,941,786,161.47 | 28% | |
| Religion & Spirituality: | $0.00 | 0% | |
| Defense: | $16,238,495,841,868.68 | 2% | |
| Law & Order: | $24,357,743,762,803.01 | 3% | |
| Commerce: | $129,907,966,734,949.41 | 16% | |
| Public Transport: | $48,715,487,525,606.02 | 6% | |
| The Environment: | $162,384,958,418,686.75 | 20% | |
| Social Equality: | $32,476,991,683,737.35 | 4% | |
| Thanksgiving DinnerWhite Market Economic Statistics ? | |||
| Gross Domestic Product: | $656,418,000,000,000.00 | ||
| GDP Per Capita: | $27,040.91 | ||
| Average Salary Per Employee: | $30,429.32 | ||
| Unemployment Rate: | 5.94% | ||
| Consumption: | $0.00 | ||
| Exports: | $93,341,053,878,272.00 | ||
| Imports: | $95,745,843,658,752.00 | ||
| Trade Net: | -2,404,789,780,480.00 | ||
| Thanksgiving Dinner Non Market Statistics ? Evasion, Black Market, Barter & Crime | |||
| Black & Grey Markets Combined: | $2,417,336,556,748,127.00 | ||
| Avg Annual Criminal's Income / Savings: ? | $131,750.04 | ||
| Recovered Product + Fines & Fees: | $54,390,072,526,832.86 | ||
| Black Market & Non Monetary Trade: | |||
| Guns & Weapons: | $13,468,794,960,061.38 | ||
| Drugs and Pharmaceuticals: | $175,094,334,480,797.88 | ||
| Extortion & Blackmail: | $148,156,744,560,675.12 | ||
| Counterfeit Goods: | $134,687,949,600,613.75 | ||
| Trafficking & Intl Sales: | $107,750,359,680,491.00 | ||
| Theft & Disappearance: | $107,750,359,680,491.00 | ||
| Counterfeit Currency & Instruments : | $67,343,974,800,306.88 | ||
| Illegal Mining, Logging, and Hunting : | $154,891,142,040,705.81 | ||
| Basic Necessitites : | $121,219,154,640,552.36 | ||
| School Loan Fraud : | $255,907,104,241,166.12 | ||
| Tax Evasion + Barter Trade : | $1,039,454,719,401,694.62 | ||
| Thanksgiving Dinner Total Market Statistics ? | |||
| National Currency: | dollar | ||
| Exchange Rates: | 1 dollar = $1.53 | ||
| $1 = 0.65 dollars | |||
| Regional Exchange Rates | |||
| Gross Domestic Product: | $656,418,000,000,000.00 - 21% | ||
| Black & Grey Markets Combined: | $2,417,336,556,748,127.00 - 79% | ||
| Real Total Economy: | $3,073,754,556,748,127.00 | ||
| Thanksgiving Economic Statistics & Links | |||
| Gross Regional Product: | $2,310,129,496,096,768 | ||
| Region Wide Imports: | $281,680,598,269,952 | ||
| Largest Regional GDP: | Thanksgiving Dinner | ||
| Largest Regional Importer: | Thanksgiving Dinner | ||
| Regional Search Functions: | All Thanksgiving Nations. | ||
| Regional Nations by GDP | Regional Trading Leaders | |||
| Regional Exchange Rates | WA Members | |||
| Returns to standard Version: | FAQ | About | About | 589,333,623 uses since September 1, 2011. | |
Version 3.69 HTML4. V 0.7 is HTML1. |
Like our Calculator? Tell your friends for us... |