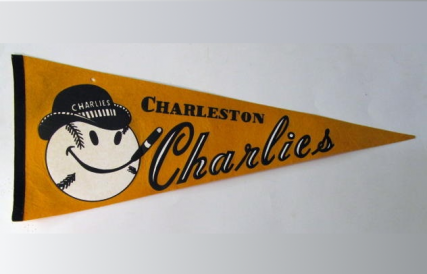
The Pittsburgh Pirates Farm Team of The Charleston Charlies
You're Sears and Roebuck material!
Region: Minor League Farm System
Quicksearch Query: The Charleston Charlies
|
Quicksearch: | |
NS Economy Mobile Home |
Regions Search |
The Charleston Charlies NS Page |
|
| GDP Leaders | Export Leaders | Interesting Places BIG Populations | Most Worked | | Militaristic States | Police States | |

You're Sears and Roebuck material!
Region: Minor League Farm System
Quicksearch Query: The Charleston Charlies
| The Charleston Charlies Domestic Statistics | |||
|---|---|---|---|
| Government Category: | Pittsburgh Pirates Farm Team | ||
| Government Priority: | Education | ||
| Economic Rating: | Good | ||
| Civil Rights Rating: | Superb | ||
| Political Freedoms: | World Benchmark | ||
| Income Tax Rate: | 13% | ||
| Consumer Confidence Rate: | 104% | ||
| Worker Enthusiasm Rate: | 108% | ||
| Major Industry: | Pizza Delivery | ||
| National Animal: | bird mascot | ||
| The Charleston Charlies Demographics | |||
| Total Population: | 5,276,000,000 | ||
| Criminals: | 569,357,816 | ||
| Elderly, Disabled, & Retirees: | 707,862,598 | ||
| Military & Reserves: ? | 120,996,494 | ||
| Students and Youth: | 926,465,600 | ||
| Unemployed but Able: | 831,638,178 | ||
| Working Class: | 2,119,679,314 | ||
| The Charleston Charlies Government Budget Details | |||
| Government Budget: | $11,490,529,373,438.61 | ||
| Government Expenditures: | $11,375,624,079,704.22 | ||
| Goverment Waste: | $114,905,293,734.39 | ||
| Goverment Efficiency: | 99% | ||
| The Charleston Charlies Government Spending Breakdown: | |||
| Administration: | $796,293,685,579.30 | 7% | |
| Social Welfare: | $2,275,124,815,940.84 | 20% | |
| Healthcare: | $1,251,318,648,767.46 | 11% | |
| Education: | $2,730,149,779,129.01 | 24% | |
| Religion & Spirituality: | $1,365,074,889,564.51 | 12% | |
| Defense: | $1,023,806,167,173.38 | 9% | |
| Law & Order: | $341,268,722,391.13 | 3% | |
| Commerce: | $0.00 | 0% | |
| Public Transport: | $1,023,806,167,173.38 | 9% | |
| The Environment: | $113,756,240,797.04 | 1% | |
| Social Equality: | $227,512,481,594.08 | 2% | |
| The Charleston CharliesWhite Market Economic Statistics ? | |||
| Gross Domestic Product: | $10,125,300,000,000.00 | ||
| GDP Per Capita: | $1,919.12 | ||
| Average Salary Per Employee: | $3,487.45 | ||
| Unemployment Rate: | 24.16% | ||
| Consumption: | $38,688,651,089,018.88 | ||
| Exports: | $5,923,353,477,120.00 | ||
| Imports: | $6,017,419,575,296.00 | ||
| Trade Net: | -94,066,098,176.00 | ||
| The Charleston Charlies Non Market Statistics ? Evasion, Black Market, Barter & Crime | |||
| Black & Grey Markets Combined: | $8,790,960,524,526.73 | ||
| Avg Annual Criminal's Income / Savings: ? | $1,090.40 | ||
| Recovered Product + Fines & Fees: | $197,796,611,801.85 | ||
| Black Market & Non Monetary Trade: | |||
| Guns & Weapons: | $293,886,205,815.19 | ||
| Drugs and Pharmaceuticals: | $710,224,997,386.71 | ||
| Extortion & Blackmail: | $171,433,620,058.86 | ||
| Counterfeit Goods: | $183,678,878,634.49 | ||
| Trafficking & Intl Sales: | $379,603,015,844.62 | ||
| Theft & Disappearance: | $318,376,722,966.46 | ||
| Counterfeit Currency & Instruments : | $355,112,498,693.36 | ||
| Illegal Mining, Logging, and Hunting : | $134,697,844,331.96 | ||
| Basic Necessitites : | $808,187,065,991.78 | ||
| School Loan Fraud : | $600,017,670,206.01 | ||
| Tax Evasion + Barter Trade : | $3,780,113,025,546.49 | ||
| The Charleston Charlies Total Market Statistics ? | |||
| National Currency: | wins above replacement | ||
| Exchange Rates: | 1 wins above replacement = $0.19 | ||
| $1 = 5.30 wins above replacements | |||
| Regional Exchange Rates | |||
| Gross Domestic Product: | $10,125,300,000,000.00 - 54% | ||
| Black & Grey Markets Combined: | $8,790,960,524,526.73 - 46% | ||
| Real Total Economy: | $18,916,260,524,526.73 | ||
| Minor League Farm System Economic Statistics & Links | |||
| Gross Regional Product: | $2,691,234,829,172,736 | ||
| Region Wide Imports: | $358,471,727,841,280 | ||
| Largest Regional GDP: | The Calgary Cannons | ||
| Largest Regional Importer: | The Calgary Cannons | ||
| Regional Search Functions: | All Minor League Farm System Nations. | ||
| Regional Nations by GDP | Regional Trading Leaders | |||
| Regional Exchange Rates | WA Members | |||
| Returns to standard Version: | FAQ | About | About | 595,478,071 uses since September 1, 2011. | |
Version 3.69 HTML4. V 0.7 is HTML1. |
Like our Calculator? Tell your friends for us... |