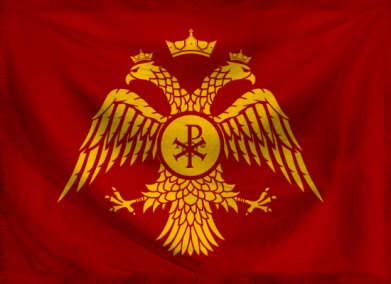
The Empire of The Eastern Roman Confederation
:)
Region: Byzantion
Quicksearch Query: The Eastern Roman Confederation
|
Quicksearch: | |
NS Economy Mobile Home |
Regions Search |
The Eastern Roman Confederation NS Page |
|
| GDP Leaders | Export Leaders | Interesting Places BIG Populations | Most Worked | | Militaristic States | Police States | |

:)
Region: Byzantion
Quicksearch Query: The Eastern Roman Confederation
| The Eastern Roman Confederation Domestic Statistics | |||
|---|---|---|---|
| Government Category: | Empire | ||
| Government Priority: | Law & Order | ||
| Economic Rating: | Powerhouse | ||
| Civil Rights Rating: | Few | ||
| Political Freedoms: | Rare | ||
| Income Tax Rate: | 63% | ||
| Consumer Confidence Rate: | 98% | ||
| Worker Enthusiasm Rate: | 97% | ||
| Major Industry: | Uranium Mining | ||
| National Animal: | Eagle | ||
| The Eastern Roman Confederation Demographics | |||
| Total Population: | 4,140,000,000 | ||
| Criminals: | 361,634,667 | ||
| Elderly, Disabled, & Retirees: | 469,682,782 | ||
| Military & Reserves: ? | 106,053,848 | ||
| Students and Youth: | 779,769,000 | ||
| Unemployed but Able: | 564,953,400 | ||
| Working Class: | 1,857,906,302 | ||
| The Eastern Roman Confederation Government Budget Details | |||
| Government Budget: | $66,789,070,468,861.12 | ||
| Government Expenditures: | $60,110,163,421,975.02 | ||
| Goverment Waste: | $6,678,907,046,886.11 | ||
| Goverment Efficiency: | 90% | ||
| The Eastern Roman Confederation Government Spending Breakdown: | |||
| Administration: | $8,415,422,879,076.50 | 14% | |
| Social Welfare: | $3,606,609,805,318.50 | 6% | |
| Healthcare: | $7,213,219,610,637.00 | 12% | |
| Education: | $5,409,914,707,977.75 | 9% | |
| Religion & Spirituality: | $0.00 | 0% | |
| Defense: | $5,409,914,707,977.75 | 9% | |
| Law & Order: | $10,819,829,415,955.50 | 18% | |
| Commerce: | $9,617,626,147,516.00 | 16% | |
| Public Transport: | $3,005,508,171,098.75 | 5% | |
| The Environment: | $3,606,609,805,318.50 | 6% | |
| Social Equality: | $3,005,508,171,098.75 | 5% | |
| The Eastern Roman ConfederationWhite Market Economic Statistics ? | |||
| Gross Domestic Product: | $47,930,600,000,000.00 | ||
| GDP Per Capita: | $11,577.44 | ||
| Average Salary Per Employee: | $15,940.44 | ||
| Unemployment Rate: | 15.29% | ||
| Consumption: | $36,500,802,885,386.24 | ||
| Exports: | $12,573,929,242,624.00 | ||
| Imports: | $12,323,490,103,296.00 | ||
| Trade Net: | 250,439,139,328.00 | ||
| The Eastern Roman Confederation Non Market Statistics ? Evasion, Black Market, Barter & Crime | |||
| Black & Grey Markets Combined: | $202,942,114,595,620.06 | ||
| Avg Annual Criminal's Income / Savings: ? | $45,402.91 | ||
| Recovered Product + Fines & Fees: | $27,397,185,470,408.71 | ||
| Black Market & Non Monetary Trade: | |||
| Guns & Weapons: | $4,502,727,432,061.67 | ||
| Drugs and Pharmaceuticals: | $8,255,000,292,113.06 | ||
| Extortion & Blackmail: | $15,009,091,440,205.57 | ||
| Counterfeit Goods: | $19,261,667,348,263.81 | ||
| Trafficking & Intl Sales: | $4,002,424,384,054.82 | ||
| Theft & Disappearance: | $8,505,151,816,116.49 | ||
| Counterfeit Currency & Instruments : | $18,261,061,252,250.11 | ||
| Illegal Mining, Logging, and Hunting : | $4,252,575,908,058.24 | ||
| Basic Necessitites : | $6,503,939,624,089.08 | ||
| School Loan Fraud : | $6,003,636,576,082.23 | ||
| Tax Evasion + Barter Trade : | $87,265,109,276,116.62 | ||
| The Eastern Roman Confederation Total Market Statistics ? | |||
| National Currency: | Solidus | ||
| Exchange Rates: | 1 Solidus = $0.85 | ||
| $1 = 1.18 Soliduss | |||
| Regional Exchange Rates | |||
| Gross Domestic Product: | $47,930,600,000,000.00 - 19% | ||
| Black & Grey Markets Combined: | $202,942,114,595,620.06 - 81% | ||
| Real Total Economy: | $250,872,714,595,620.06 | ||
| Byzantion Economic Statistics & Links | |||
| Gross Regional Product: | $454,333,988,601,856 | ||
| Region Wide Imports: | $57,908,930,805,760 | ||
| Largest Regional GDP: | The Western Roman Confederation | ||
| Largest Regional Importer: | The Western Roman Confederation | ||
| Regional Search Functions: | All Byzantion Nations. | ||
| Regional Nations by GDP | Regional Trading Leaders | |||
| Regional Exchange Rates | WA Members | |||
| Returns to standard Version: | FAQ | About | About | 597,072,807 uses since September 1, 2011. | |
Version 3.69 HTML4. V 0.7 is HTML1. |
Like our Calculator? Tell your friends for us... |