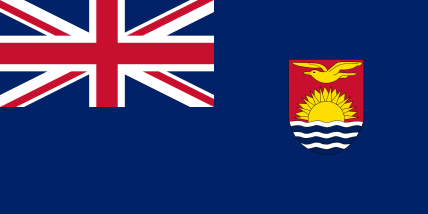
The British Colony of The Gilbert and Ellice Islands
God Save the Queen
Region: Balder
Quicksearch Query: The Gilbert and Ellice Islands
|
Quicksearch: | |
NS Economy Mobile Home |
Regions Search |
The Gilbert and Ellice Islands NS Page |
|
| GDP Leaders | Export Leaders | Interesting Places BIG Populations | Most Worked | | Militaristic States | Police States | |

God Save the Queen
Region: Balder
Quicksearch Query: The Gilbert and Ellice Islands
| The Gilbert and Ellice Islands Domestic Statistics | |||
|---|---|---|---|
| Government Category: | British Colony | ||
| Government Priority: | Law & Order | ||
| Economic Rating: | All-Consuming | ||
| Civil Rights Rating: | Rare | ||
| Political Freedoms: | Good | ||
| Income Tax Rate: | 65% | ||
| Consumer Confidence Rate: | 97% | ||
| Worker Enthusiasm Rate: | 101% | ||
| Major Industry: | Uranium Mining | ||
| National Animal: | frigatebird | ||
| The Gilbert and Ellice Islands Demographics | |||
| Total Population: | 14,630,000,000 | ||
| Criminals: | 1,010,750,960 | ||
| Elderly, Disabled, & Retirees: | 1,731,991,434 | ||
| Military & Reserves: ? | 391,876,078 | ||
| Students and Youth: | 2,768,727,500 | ||
| Unemployed but Able: | 1,861,565,691 | ||
| Working Class: | 6,865,088,336 | ||
| The Gilbert and Ellice Islands Government Budget Details | |||
| Government Budget: | $319,598,251,664,191.00 | ||
| Government Expenditures: | $306,814,321,597,623.38 | ||
| Goverment Waste: | $12,783,930,066,567.62 | ||
| Goverment Efficiency: | 96% | ||
| The Gilbert and Ellice Islands Government Spending Breakdown: | |||
| Administration: | $36,817,718,591,714.80 | 12% | |
| Social Welfare: | $15,340,716,079,881.17 | 5% | |
| Healthcare: | $18,408,859,295,857.40 | 6% | |
| Education: | $27,613,288,943,786.10 | 9% | |
| Religion & Spirituality: | $33,749,575,375,738.57 | 11% | |
| Defense: | $27,613,288,943,786.10 | 9% | |
| Law & Order: | $58,294,721,103,548.45 | 19% | |
| Commerce: | $36,817,718,591,714.80 | 12% | |
| Public Transport: | $12,272,572,863,904.94 | 4% | |
| The Environment: | $0.00 | 0% | |
| Social Equality: | $21,477,002,511,833.64 | 7% | |
| The Gilbert and Ellice IslandsWhite Market Economic Statistics ? | |||
| Gross Domestic Product: | $246,628,000,000,000.00 | ||
| GDP Per Capita: | $16,857.69 | ||
| Average Salary Per Employee: | $22,877.19 | ||
| Unemployment Rate: | 11.42% | ||
| Consumption: | $150,884,034,858,188.78 | ||
| Exports: | $54,841,697,370,112.00 | ||
| Imports: | $58,985,075,965,952.00 | ||
| Trade Net: | -4,143,378,595,840.00 | ||
| The Gilbert and Ellice Islands Non Market Statistics ? Evasion, Black Market, Barter & Crime | |||
| Black & Grey Markets Combined: | $870,579,463,516,912.25 | ||
| Avg Annual Criminal's Income / Savings: ? | $70,369.24 | ||
| Recovered Product + Fines & Fees: | $124,057,573,551,160.02 | ||
| Black Market & Non Monetary Trade: | |||
| Guns & Weapons: | $24,999,151,790,228.12 | ||
| Drugs and Pharmaceuticals: | $34,041,398,182,438.30 | ||
| Extortion & Blackmail: | $51,062,097,273,657.45 | ||
| Counterfeit Goods: | $75,529,352,217,284.97 | ||
| Trafficking & Intl Sales: | $20,212,080,170,822.74 | ||
| Theft & Disappearance: | $27,658,636,023,231.12 | ||
| Counterfeit Currency & Instruments : | $75,529,352,217,284.97 | ||
| Illegal Mining, Logging, and Hunting : | $4,255,174,772,804.79 | ||
| Basic Necessitites : | $27,658,636,023,231.12 | ||
| School Loan Fraud : | $19,148,286,477,621.54 | ||
| Tax Evasion + Barter Trade : | $374,349,169,312,272.25 | ||
| The Gilbert and Ellice Islands Total Market Statistics ? | |||
| National Currency: | Australian Pound | ||
| Exchange Rates: | 1 Australian Pound = $1.12 | ||
| $1 = 0.89 Australian Pounds | |||
| Regional Exchange Rates | |||
| Gross Domestic Product: | $246,628,000,000,000.00 - 22% | ||
| Black & Grey Markets Combined: | $870,579,463,516,912.25 - 78% | ||
| Real Total Economy: | $1,117,207,463,516,912.25 | ||
| Balder Economic Statistics & Links | |||
| Gross Regional Product: | $2,220,992,185,069,731,840 | ||
| Region Wide Imports: | $282,541,777,867,505,664 | ||
| Largest Regional GDP: | Nianacio | ||
| Largest Regional Importer: | Nianacio | ||
| Regional Search Functions: | All Balder Nations. | ||
| Regional Nations by GDP | Regional Trading Leaders | |||
| Regional Exchange Rates | WA Members | |||
| Returns to standard Version: | FAQ | About | About | 598,322,210 uses since September 1, 2011. | |
Version 3.69 HTML4. V 0.7 is HTML1. |
Like our Calculator? Tell your friends for us... |