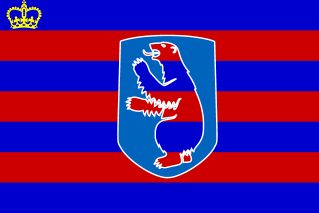
The Empire of The Greater Nordics
F?r folket, F?r Norden !! Ihmisille, Pohjoismaille !!
Region: Official European Union
Quicksearch Query: The Greater Nordics
|
Quicksearch: | |
NS Economy Mobile Home |
Regions Search |
The Greater Nordics NS Page |
|
| GDP Leaders | Export Leaders | Interesting Places BIG Populations | Most Worked | | Militaristic States | Police States | |

F?r folket, F?r Norden !! Ihmisille, Pohjoismaille !!
Region: Official European Union
Quicksearch Query: The Greater Nordics
| The Greater Nordics Domestic Statistics | |||
|---|---|---|---|
| Government Category: | Empire | ||
| Government Priority: | Defence | ||
| Economic Rating: | Frightening | ||
| Civil Rights Rating: | Good | ||
| Political Freedoms: | Average | ||
| Income Tax Rate: | 16% | ||
| Consumer Confidence Rate: | 105% | ||
| Worker Enthusiasm Rate: | 106% | ||
| Major Industry: | Tourism | ||
| National Animal: | artic fox | ||
| The Greater Nordics Demographics | |||
| Total Population: | 16,792,000,000 | ||
| Criminals: | 1,495,446,615 | ||
| Elderly, Disabled, & Retirees: | 2,254,300,952 | ||
| Military & Reserves: ? | 838,349,273 | ||
| Students and Youth: | 2,901,657,600 | ||
| Unemployed but Able: | 2,378,101,563 | ||
| Working Class: | 6,924,143,996 | ||
| The Greater Nordics Government Budget Details | |||
| Government Budget: | $183,156,012,384,245.53 | ||
| Government Expenditures: | $175,829,771,888,875.72 | ||
| Goverment Waste: | $7,326,240,495,369.81 | ||
| Goverment Efficiency: | 96% | ||
| The Greater Nordics Government Spending Breakdown: | |||
| Administration: | $29,891,061,221,108.88 | 17% | |
| Social Welfare: | $5,274,893,156,666.27 | 3% | |
| Healthcare: | $14,066,381,751,110.06 | 8% | |
| Education: | $28,132,763,502,220.12 | 16% | |
| Religion & Spirituality: | $1,758,297,718,888.76 | 1% | |
| Defense: | $31,649,358,939,997.63 | 18% | |
| Law & Order: | $15,824,679,469,998.81 | 9% | |
| Commerce: | $19,341,274,907,776.33 | 11% | |
| Public Transport: | $8,791,488,594,443.79 | 5% | |
| The Environment: | $17,582,977,188,887.57 | 10% | |
| Social Equality: | $0.00 | 0% | |
| The Greater NordicsWhite Market Economic Statistics ? | |||
| Gross Domestic Product: | $150,679,000,000,000.00 | ||
| GDP Per Capita: | $8,973.26 | ||
| Average Salary Per Employee: | $15,743.28 | ||
| Unemployment Rate: | 17.45% | ||
| Consumption: | $549,782,198,408,970.25 | ||
| Exports: | $82,176,406,716,416.00 | ||
| Imports: | $86,383,452,487,680.00 | ||
| Trade Net: | -4,207,045,771,264.00 | ||
| The Greater Nordics Non Market Statistics ? Evasion, Black Market, Barter & Crime | |||
| Black & Grey Markets Combined: | $165,582,500,283,889.97 | ||
| Avg Annual Criminal's Income / Savings: ? | $8,958.29 | ||
| Recovered Product + Fines & Fees: | $11,176,818,769,162.57 | ||
| Black Market & Non Monetary Trade: | |||
| Guns & Weapons: | $8,031,025,509,784.76 | ||
| Drugs and Pharmaceuticals: | $7,260,927,173,230.06 | ||
| Extortion & Blackmail: | $12,321,573,384,875.25 | ||
| Counterfeit Goods: | $12,761,629,577,192.22 | ||
| Trafficking & Intl Sales: | $4,620,590,019,328.22 | ||
| Theft & Disappearance: | $3,520,449,538,535.78 | ||
| Counterfeit Currency & Instruments : | $15,401,966,731,094.06 | ||
| Illegal Mining, Logging, and Hunting : | $5,500,702,403,962.16 | ||
| Basic Necessitites : | $4,840,618,115,486.70 | ||
| School Loan Fraud : | $9,241,180,038,656.43 | ||
| Tax Evasion + Barter Trade : | $71,200,475,122,072.69 | ||
| The Greater Nordics Total Market Statistics ? | |||
| National Currency: | Krona | ||
| Exchange Rates: | 1 Krona = $0.88 | ||
| $1 = 1.13 Kronas | |||
| Regional Exchange Rates | |||
| Gross Domestic Product: | $150,679,000,000,000.00 - 48% | ||
| Black & Grey Markets Combined: | $165,582,500,283,889.97 - 52% | ||
| Real Total Economy: | $316,261,500,283,890.00 | ||
| Official European Union Economic Statistics & Links | |||
| Gross Regional Product: | $1,206,226,666,913,792 | ||
| Region Wide Imports: | $151,448,398,594,048 | ||
| Largest Regional GDP: | The Greater Nordics | ||
| Largest Regional Importer: | The Greater Nordics | ||
| Regional Search Functions: | All Official European Union Nations. | ||
| Regional Nations by GDP | Regional Trading Leaders | |||
| Regional Exchange Rates | WA Members | |||
| Returns to standard Version: | FAQ | About | About | 597,908,299 uses since September 1, 2011. | |
Version 3.69 HTML4. V 0.7 is HTML1. |
Like our Calculator? Tell your friends for us... |