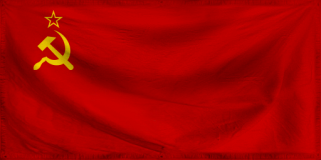
The Dictatorship of The Soviet States of Markov
Twirling Toward Freedom
Region: Robot Industries
Quicksearch Query: The Soviet States of Markov
|
Quicksearch: | |
NS Economy Mobile Home |
Regions Search |
The Soviet States of Markov NS Page |
|
| GDP Leaders | Export Leaders | Interesting Places BIG Populations | Most Worked | | Militaristic States | Police States | |

Twirling Toward Freedom
Region: Robot Industries
Quicksearch Query: The Soviet States of Markov
| The Soviet States of Markov Domestic Statistics | |||
|---|---|---|---|
| Government Category: | Dictatorship | ||
| Government Priority: | Defence | ||
| Economic Rating: | Strong | ||
| Civil Rights Rating: | Few | ||
| Political Freedoms: | Few | ||
| Income Tax Rate: | 65% | ||
| Consumer Confidence Rate: | 97% | ||
| Worker Enthusiasm Rate: | 98% | ||
| Major Industry: | Arms Manufacturing | ||
| National Animal: | brown bear | ||
| The Soviet States of Markov Demographics | |||
| Total Population: | 15,129,000,000 | ||
| Criminals: | 1,608,822,514 | ||
| Elderly, Disabled, & Retirees: | 1,758,585,367 | ||
| Military & Reserves: ? | 959,761,884 | ||
| Students and Youth: | 2,813,994,000 | ||
| Unemployed but Able: | 2,282,585,035 | ||
| Working Class: | 5,705,251,200 | ||
| The Soviet States of Markov Government Budget Details | |||
| Government Budget: | $102,348,730,602,933.45 | ||
| Government Expenditures: | $94,160,832,154,698.78 | ||
| Goverment Waste: | $8,187,898,448,234.67 | ||
| Goverment Efficiency: | 92% | ||
| The Soviet States of Markov Government Spending Breakdown: | |||
| Administration: | $9,416,083,215,469.88 | 10% | |
| Social Welfare: | $0.00 | 0% | |
| Healthcare: | $7,532,866,572,375.90 | 8% | |
| Education: | $7,532,866,572,375.90 | 8% | |
| Religion & Spirituality: | $0.00 | 0% | |
| Defense: | $22,598,599,717,127.71 | 24% | |
| Law & Order: | $18,832,166,430,939.76 | 20% | |
| Commerce: | $9,416,083,215,469.88 | 10% | |
| Public Transport: | $7,532,866,572,375.90 | 8% | |
| The Environment: | $5,649,649,929,281.93 | 6% | |
| Social Equality: | $3,766,433,286,187.95 | 4% | |
| The Soviet States of MarkovWhite Market Economic Statistics ? | |||
| Gross Domestic Product: | $71,681,200,000,000.00 | ||
| GDP Per Capita: | $4,738.00 | ||
| Average Salary Per Employee: | $7,763.22 | ||
| Unemployment Rate: | 21.33% | ||
| Consumption: | $50,469,237,948,416.00 | ||
| Exports: | $14,905,046,466,560.00 | ||
| Imports: | $18,638,918,647,808.00 | ||
| Trade Net: | -3,733,872,181,248.00 | ||
| The Soviet States of Markov Non Market Statistics ? Evasion, Black Market, Barter & Crime | |||
| Black & Grey Markets Combined: | $302,110,289,685,898.81 | ||
| Avg Annual Criminal's Income / Savings: ? | $18,196.07 | ||
| Recovered Product + Fines & Fees: | $45,316,543,452,884.83 | ||
| Black Market & Non Monetary Trade: | |||
| Guns & Weapons: | $17,564,692,242,338.16 | ||
| Drugs and Pharmaceuticals: | $8,782,346,121,169.08 | ||
| Extortion & Blackmail: | $14,637,243,535,281.80 | ||
| Counterfeit Goods: | $30,738,211,424,091.77 | ||
| Trafficking & Intl Sales: | $8,050,483,944,404.99 | ||
| Theft & Disappearance: | $8,782,346,121,169.08 | ||
| Counterfeit Currency & Instruments : | $30,738,211,424,091.77 | ||
| Illegal Mining, Logging, and Hunting : | $7,318,621,767,640.90 | ||
| Basic Necessitites : | $4,391,173,060,584.54 | ||
| School Loan Fraud : | $8,050,483,944,404.99 | ||
| Tax Evasion + Barter Trade : | $129,907,424,564,936.48 | ||
| The Soviet States of Markov Total Market Statistics ? | |||
| National Currency: | shmeckle | ||
| Exchange Rates: | 1 shmeckle = $0.34 | ||
| $1 = 2.92 shmeckles | |||
| Regional Exchange Rates | |||
| Gross Domestic Product: | $71,681,200,000,000.00 - 19% | ||
| Black & Grey Markets Combined: | $302,110,289,685,898.81 - 81% | ||
| Real Total Economy: | $373,791,489,685,898.81 | ||
| Robot Industries Economic Statistics & Links | |||
| Gross Regional Product: | $629,047,151,296,512 | ||
| Region Wide Imports: | $65,021,627,334,656 | ||
| Largest Regional GDP: | The Soviet States of Krayev | ||
| Largest Regional Importer: | The Soviet States of Krayev | ||
| Regional Search Functions: | All Robot Industries Nations. | ||
| Regional Nations by GDP | Regional Trading Leaders | |||
| Regional Exchange Rates | WA Members | |||
| Returns to standard Version: | FAQ | About | About | 582,592,806 uses since September 1, 2011. | |
Version 3.69 HTML4. V 0.7 is HTML1. |
Like our Calculator? Tell your friends for us... |