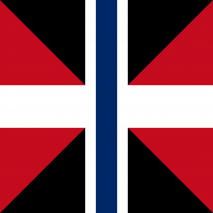
The Confederacy of The Svalbard Islands
Leave us alone, but trade freely
Region: Auralia
Quicksearch Query: The Svalbard Islands
|
Quicksearch: | |
NS Economy Mobile Home |
Regions Search |
The Svalbard Islands NS Page |
|
| GDP Leaders | Export Leaders | Interesting Places BIG Populations | Most Worked | | Militaristic States | Police States | |

Leave us alone, but trade freely
Region: Auralia
Quicksearch Query: The Svalbard Islands
| The Svalbard Islands Domestic Statistics | |||
|---|---|---|---|
| Government Category: | Confederacy | ||
| Government Priority: | Defence | ||
| Economic Rating: | Thriving | ||
| Civil Rights Rating: | Excessive | ||
| Political Freedoms: | Excessive | ||
| Income Tax Rate: | 9% | ||
| Consumer Confidence Rate: | 103% | ||
| Worker Enthusiasm Rate: | 106% | ||
| Major Industry: | Beef-Based Agriculture | ||
| National Animal: | kraken | ||
| The Svalbard Islands Demographics | |||
| Total Population: | 13,294,000,000 | ||
| Criminals: | 1,405,572,661 | ||
| Elderly, Disabled, & Retirees: | 1,874,305,471 | ||
| Military & Reserves: ? | 1,564,785,904 | ||
| Students and Youth: | 2,186,863,000 | ||
| Unemployed but Able: | 2,031,755,521 | ||
| Working Class: | 4,230,717,443 | ||
| The Svalbard Islands Government Budget Details | |||
| Government Budget: | $60,555,104,293,486.59 | ||
| Government Expenditures: | $57,527,349,078,812.26 | ||
| Goverment Waste: | $3,027,755,214,674.34 | ||
| Goverment Efficiency: | 95% | ||
| The Svalbard Islands Government Spending Breakdown: | |||
| Administration: | $0.00 | 0% | |
| Social Welfare: | $0.00 | 0% | |
| Healthcare: | $17,833,478,214,431.80 | 31% | |
| Education: | $5,752,734,907,881.23 | 10% | |
| Religion & Spirituality: | $0.00 | 0% | |
| Defense: | $25,887,307,085,465.52 | 45% | |
| Law & Order: | $8,053,828,871,033.72 | 14% | |
| Commerce: | $0.00 | 0% | |
| Public Transport: | $0.00 | 0% | |
| The Environment: | $0.00 | 0% | |
| Social Equality: | $0.00 | 0% | |
| The Svalbard IslandsWhite Market Economic Statistics ? | |||
| Gross Domestic Product: | $51,846,600,000,000.00 | ||
| GDP Per Capita: | $3,900.00 | ||
| Average Salary Per Employee: | $8,696.86 | ||
| Unemployment Rate: | 22.15% | ||
| Consumption: | $264,261,574,905,036.81 | ||
| Exports: | $38,598,756,499,456.00 | ||
| Imports: | $39,052,371,820,544.00 | ||
| Trade Net: | -453,615,321,088.00 | ||
| The Svalbard Islands Non Market Statistics ? Evasion, Black Market, Barter & Crime | |||
| Black & Grey Markets Combined: | $42,053,807,686,092.13 | ||
| Avg Annual Criminal's Income / Savings: ? | $3,511.66 | ||
| Recovered Product + Fines & Fees: | $4,415,649,807,039.68 | ||
| Black Market & Non Monetary Trade: | |||
| Guns & Weapons: | $4,827,093,747,988.48 | ||
| Drugs and Pharmaceuticals: | $3,861,674,998,390.78 | ||
| Extortion & Blackmail: | $0.00 | ||
| Counterfeit Goods: | $3,915,309,373,368.43 | ||
| Trafficking & Intl Sales: | $0.00 | ||
| Theft & Disappearance: | $3,325,331,248,614.28 | ||
| Counterfeit Currency & Instruments : | $3,915,309,373,368.43 | ||
| Illegal Mining, Logging, and Hunting : | $0.00 | ||
| Basic Necessitites : | $536,343,749,776.50 | ||
| School Loan Fraud : | $1,072,687,499,553.00 | ||
| Tax Evasion + Barter Trade : | $18,083,137,305,019.62 | ||
| The Svalbard Islands Total Market Statistics ? | |||
| National Currency: | ?re | ||
| Exchange Rates: | 1 ?re = $0.44 | ||
| $1 = 2.28 ?res | |||
| Regional Exchange Rates | |||
| Gross Domestic Product: | $51,846,600,000,000.00 - 55% | ||
| Black & Grey Markets Combined: | $42,053,807,686,092.13 - 45% | ||
| Real Total Economy: | $93,900,407,686,092.12 | ||
| Auralia Economic Statistics & Links | |||
| Gross Regional Product: | $1,598,621,455,745,024 | ||
| Region Wide Imports: | $212,484,044,619,776 | ||
| Largest Regional GDP: | Nord-Norden | ||
| Largest Regional Importer: | Nord-Norden | ||
| Regional Search Functions: | All Auralia Nations. | ||
| Regional Nations by GDP | Regional Trading Leaders | |||
| Regional Exchange Rates | WA Members | |||
| Returns to standard Version: | FAQ | About | About | 589,095,873 uses since September 1, 2011. | |
Version 3.69 HTML4. V 0.7 is HTML1. |
Like our Calculator? Tell your friends for us... |