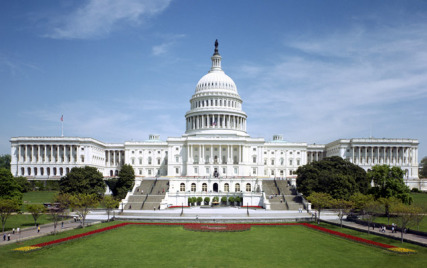
The Building of The United States Capitol
In God We Trust
Region: Washington DC
Quicksearch Query: The United States Capitol
|
Quicksearch: | |
NS Economy Mobile Home |
Regions Search |
The United States Capitol NS Page |
|
| GDP Leaders | Export Leaders | Interesting Places BIG Populations | Most Worked | | Militaristic States | Police States | |

In God We Trust
Region: Washington DC
Quicksearch Query: The United States Capitol
| The United States Capitol Domestic Statistics | |||
|---|---|---|---|
| Government Category: | Building | ||
| Government Priority: | Law & Order | ||
| Economic Rating: | Good | ||
| Civil Rights Rating: | Average | ||
| Political Freedoms: | Excellent | ||
| Income Tax Rate: | 27% | ||
| Consumer Confidence Rate: | 100% | ||
| Worker Enthusiasm Rate: | 103% | ||
| Major Industry: | Soda Sales | ||
| National Animal: | bald eagle | ||
| The United States Capitol Demographics | |||
| Total Population: | 7,413,000,000 | ||
| Criminals: | 794,282,949 | ||
| Elderly, Disabled, & Retirees: | 862,002,718 | ||
| Military & Reserves: ? | 266,460,404 | ||
| Students and Youth: | 1,426,261,200 | ||
| Unemployed but Able: | 1,158,305,468 | ||
| Working Class: | 2,905,687,261 | ||
| The United States Capitol Government Budget Details | |||
| Government Budget: | $22,231,099,188,948.50 | ||
| Government Expenditures: | $21,786,477,205,169.53 | ||
| Goverment Waste: | $444,621,983,778.97 | ||
| Goverment Efficiency: | 98% | ||
| The United States Capitol Government Spending Breakdown: | |||
| Administration: | $0.00 | 0% | |
| Social Welfare: | $1,089,323,860,258.48 | 5% | |
| Healthcare: | $1,960,782,948,465.26 | 9% | |
| Education: | $5,228,754,529,240.69 | 24% | |
| Religion & Spirituality: | $3,050,106,808,723.74 | 14% | |
| Defense: | $3,050,106,808,723.74 | 14% | |
| Law & Order: | $5,446,619,301,292.38 | 25% | |
| Commerce: | $1,525,053,404,361.87 | 7% | |
| Public Transport: | $0.00 | 0% | |
| The Environment: | $653,594,316,155.09 | 3% | |
| Social Equality: | $0.00 | 0% | |
| The United States CapitolWhite Market Economic Statistics ? | |||
| Gross Domestic Product: | $18,360,600,000,000.00 | ||
| GDP Per Capita: | $2,476.81 | ||
| Average Salary Per Employee: | $4,230.47 | ||
| Unemployment Rate: | 23.59% | ||
| Consumption: | $41,844,347,229,962.24 | ||
| Exports: | $7,623,497,089,024.00 | ||
| Imports: | $7,954,025,152,512.00 | ||
| Trade Net: | -330,528,063,488.00 | ||
| The United States Capitol Non Market Statistics ? Evasion, Black Market, Barter & Crime | |||
| Black & Grey Markets Combined: | $23,801,053,724,447.55 | ||
| Avg Annual Criminal's Income / Savings: ? | $2,744.09 | ||
| Recovered Product + Fines & Fees: | $4,462,697,573,333.92 | ||
| Black Market & Non Monetary Trade: | |||
| Guns & Weapons: | $964,500,513,036.79 | ||
| Drugs and Pharmaceuticals: | $1,543,200,820,858.87 | ||
| Extortion & Blackmail: | $385,800,205,214.72 | ||
| Counterfeit Goods: | $2,149,458,286,196.28 | ||
| Trafficking & Intl Sales: | $468,471,677,760.73 | ||
| Theft & Disappearance: | $496,028,835,276.07 | ||
| Counterfeit Currency & Instruments : | $1,763,658,080,981.56 | ||
| Illegal Mining, Logging, and Hunting : | $165,342,945,092.02 | ||
| Basic Necessitites : | $936,943,355,521.46 | ||
| School Loan Fraud : | $1,405,415,033,282.18 | ||
| Tax Evasion + Barter Trade : | $10,234,453,101,512.45 | ||
| The United States Capitol Total Market Statistics ? | |||
| National Currency: | dollar | ||
| Exchange Rates: | 1 dollar = $0.21 | ||
| $1 = 4.66 dollars | |||
| Regional Exchange Rates | |||
| Gross Domestic Product: | $18,360,600,000,000.00 - 44% | ||
| Black & Grey Markets Combined: | $23,801,053,724,447.55 - 56% | ||
| Real Total Economy: | $42,161,653,724,447.55 | ||
| Washington DC Economic Statistics & Links | |||
| Gross Regional Product: | $3,336,188,324,741,120 | ||
| Region Wide Imports: | $443,701,461,516,288 | ||
| Largest Regional GDP: | One Observatory Circle | ||
| Largest Regional Importer: | One Observatory Circle | ||
| Regional Search Functions: | All Washington DC Nations. | ||
| Regional Nations by GDP | Regional Trading Leaders | |||
| Regional Exchange Rates | WA Members | |||
| Returns to standard Version: | FAQ | About | About | 584,963,431 uses since September 1, 2011. | |
Version 3.69 HTML4. V 0.7 is HTML1. |
Like our Calculator? Tell your friends for us... |