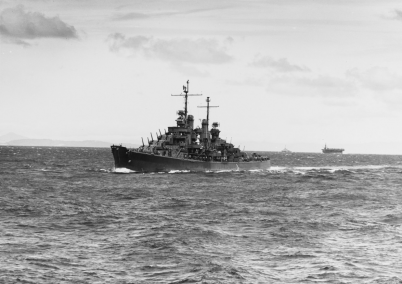
The Federation of USS Oakland
Hummanty is at risk we must FIGHT
Region: Reserve Fleet
Quicksearch Query: USS Oakland
|
Quicksearch: | |
NS Economy Mobile Home |
Regions Search |
USS Oakland NS Page |
|
| GDP Leaders | Export Leaders | Interesting Places BIG Populations | Most Worked | | Militaristic States | Police States | |

Hummanty is at risk we must FIGHT
Region: Reserve Fleet
Quicksearch Query: USS Oakland
| USS Oakland Domestic Statistics | |||
|---|---|---|---|
| Government Category: | Federation | ||
| Government Priority: | Defence | ||
| Economic Rating: | Strong | ||
| Civil Rights Rating: | Few | ||
| Political Freedoms: | Good | ||
| Income Tax Rate: | 18% | ||
| Consumer Confidence Rate: | 97% | ||
| Worker Enthusiasm Rate: | 100% | ||
| Major Industry: | Cheese Exports | ||
| National Animal: | Kitsune | ||
| USS Oakland Demographics | |||
| Total Population: | 3,626,000,000 | ||
| Criminals: | 398,515,268 | ||
| Elderly, Disabled, & Retirees: | 501,602,252 | ||
| Military & Reserves: ? | 195,099,142 | ||
| Students and Youth: | 609,530,600 | ||
| Unemployed but Able: | 567,945,993 | ||
| Working Class: | 1,353,306,745 | ||
| USS Oakland Government Budget Details | |||
| Government Budget: | $10,205,282,516,022.07 | ||
| Government Expenditures: | $9,797,071,215,381.19 | ||
| Goverment Waste: | $408,211,300,640.88 | ||
| Goverment Efficiency: | 96% | ||
| USS Oakland Government Spending Breakdown: | |||
| Administration: | $1,273,619,257,999.55 | 13% | |
| Social Welfare: | $685,794,985,076.68 | 7% | |
| Healthcare: | $1,273,619,257,999.55 | 13% | |
| Education: | $881,736,409,384.31 | 9% | |
| Religion & Spirituality: | $0.00 | 0% | |
| Defense: | $2,057,384,955,230.05 | 21% | |
| Law & Order: | $1,469,560,682,307.18 | 15% | |
| Commerce: | $587,824,272,922.87 | 6% | |
| Public Transport: | $881,736,409,384.31 | 9% | |
| The Environment: | $293,912,136,461.44 | 3% | |
| Social Equality: | $489,853,560,769.06 | 5% | |
| USS OaklandWhite Market Economic Statistics ? | |||
| Gross Domestic Product: | $8,421,200,000,000.00 | ||
| GDP Per Capita: | $2,322.45 | ||
| Average Salary Per Employee: | $3,923.40 | ||
| Unemployment Rate: | 23.74% | ||
| Consumption: | $28,864,278,639,411.20 | ||
| Exports: | $4,873,556,852,736.00 | ||
| Imports: | $4,982,216,065,024.00 | ||
| Trade Net: | -108,659,212,288.00 | ||
| USS Oakland Non Market Statistics ? Evasion, Black Market, Barter & Crime | |||
| Black & Grey Markets Combined: | $19,870,515,219,664.50 | ||
| Avg Annual Criminal's Income / Savings: ? | $4,420.33 | ||
| Recovered Product + Fines & Fees: | $2,235,432,962,212.26 | ||
| Black Market & Non Monetary Trade: | |||
| Guns & Weapons: | $1,055,459,673,108.52 | ||
| Drugs and Pharmaceuticals: | $879,549,727,590.43 | ||
| Extortion & Blackmail: | $954,939,704,241.04 | ||
| Counterfeit Goods: | $1,583,189,509,662.78 | ||
| Trafficking & Intl Sales: | $527,729,836,554.26 | ||
| Theft & Disappearance: | $904,679,719,807.30 | ||
| Counterfeit Currency & Instruments : | $1,935,009,400,698.95 | ||
| Illegal Mining, Logging, and Hunting : | $376,949,883,253.04 | ||
| Basic Necessitites : | $703,639,782,072.35 | ||
| School Loan Fraud : | $527,729,836,554.26 | ||
| Tax Evasion + Barter Trade : | $8,544,321,544,455.74 | ||
| USS Oakland Total Market Statistics ? | |||
| National Currency: | Delta Eagle | ||
| Exchange Rates: | 1 Delta Eagle = $0.24 | ||
| $1 = 4.17 Delta Eagles | |||
| Regional Exchange Rates | |||
| Gross Domestic Product: | $8,421,200,000,000.00 - 30% | ||
| Black & Grey Markets Combined: | $19,870,515,219,664.50 - 70% | ||
| Real Total Economy: | $28,291,715,219,664.50 | ||
| Reserve Fleet Economic Statistics & Links | |||
| Gross Regional Product: | $878,401,611,104,256 | ||
| Region Wide Imports: | $121,616,444,948,480 | ||
| Largest Regional GDP: | USS Los Angeles | ||
| Largest Regional Importer: | USS Los Angeles | ||
| Regional Search Functions: | All Reserve Fleet Nations. | ||
| Regional Nations by GDP | Regional Trading Leaders | |||
| Regional Exchange Rates | WA Members | |||
| Returns to standard Version: | FAQ | About | About | 596,287,270 uses since September 1, 2011. | |
Version 3.69 HTML4. V 0.7 is HTML1. |
Like our Calculator? Tell your friends for us... |