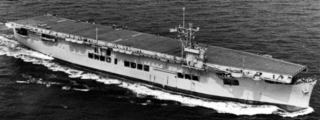
The Empire of USS Sangamon
Hummanty is at risk we must FIGHT
Region: British Territories
Quicksearch Query: USS Sangamon
|
Quicksearch: | |
NS Economy Mobile Home |
Regions Search |
USS Sangamon NS Page |
|
| GDP Leaders | Export Leaders | Interesting Places BIG Populations | Most Worked | | Militaristic States | Police States | |

Hummanty is at risk we must FIGHT
Region: British Territories
Quicksearch Query: USS Sangamon
| USS Sangamon Domestic Statistics | |||
|---|---|---|---|
| Government Category: | Empire | ||
| Government Priority: | Defence | ||
| Economic Rating: | Good | ||
| Civil Rights Rating: | Good | ||
| Political Freedoms: | Good | ||
| Income Tax Rate: | 19% | ||
| Consumer Confidence Rate: | 101% | ||
| Worker Enthusiasm Rate: | 103% | ||
| Major Industry: | Information Technology | ||
| National Animal: | Kitsune | ||
| USS Sangamon Demographics | |||
| Total Population: | 4,065,000,000 | ||
| Criminals: | 451,218,698 | ||
| Elderly, Disabled, & Retirees: | 556,509,129 | ||
| Military & Reserves: ? | 155,550,574 | ||
| Students and Youth: | 689,017,500 | ||
| Unemployed but Able: | 639,914,963 | ||
| Working Class: | 1,572,789,136 | ||
| USS Sangamon Government Budget Details | |||
| Government Budget: | $9,651,736,169,183.97 | ||
| Government Expenditures: | $9,265,666,722,416.61 | ||
| Goverment Waste: | $386,069,446,767.36 | ||
| Goverment Efficiency: | 96% | ||
| USS Sangamon Government Spending Breakdown: | |||
| Administration: | $926,566,672,241.66 | 10% | |
| Social Welfare: | $1,019,223,339,465.83 | 11% | |
| Healthcare: | $1,019,223,339,465.83 | 11% | |
| Education: | $926,566,672,241.66 | 10% | |
| Religion & Spirituality: | $277,970,001,672.50 | 3% | |
| Defense: | $1,389,850,008,362.49 | 15% | |
| Law & Order: | $1,389,850,008,362.49 | 15% | |
| Commerce: | $370,626,668,896.67 | 4% | |
| Public Transport: | $926,566,672,241.66 | 10% | |
| The Environment: | $370,626,668,896.67 | 4% | |
| Social Equality: | $463,283,336,120.83 | 5% | |
| USS SangamonWhite Market Economic Statistics ? | |||
| Gross Domestic Product: | $8,139,320,000,000.00 | ||
| GDP Per Capita: | $2,002.29 | ||
| Average Salary Per Employee: | $3,499.37 | ||
| Unemployment Rate: | 24.08% | ||
| Consumption: | $25,710,031,232,040.96 | ||
| Exports: | $4,408,553,054,208.00 | ||
| Imports: | $4,328,747,958,272.00 | ||
| Trade Net: | 79,805,095,936.00 | ||
| USS Sangamon Non Market Statistics ? Evasion, Black Market, Barter & Crime | |||
| Black & Grey Markets Combined: | $9,519,561,216,027.84 | ||
| Avg Annual Criminal's Income / Savings: ? | $1,758.12 | ||
| Recovered Product + Fines & Fees: | $1,070,950,636,803.13 | ||
| Black Market & Non Monetary Trade: | |||
| Guns & Weapons: | $379,237,007,374.95 | ||
| Drugs and Pharmaceuticals: | $421,374,452,638.83 | ||
| Extortion & Blackmail: | $337,099,562,111.07 | ||
| Counterfeit Goods: | $638,081,313,995.95 | ||
| Trafficking & Intl Sales: | $325,060,292,035.67 | ||
| Theft & Disappearance: | $385,256,642,412.65 | ||
| Counterfeit Currency & Instruments : | $782,552,554,900.69 | ||
| Illegal Mining, Logging, and Hunting : | $216,706,861,357.11 | ||
| Basic Necessitites : | $445,452,992,789.62 | ||
| School Loan Fraud : | $288,942,481,809.49 | ||
| Tax Evasion + Barter Trade : | $4,093,411,322,891.97 | ||
| USS Sangamon Total Market Statistics ? | |||
| National Currency: | Delta Eagle | ||
| Exchange Rates: | 1 Delta Eagle = $0.19 | ||
| $1 = 5.19 Delta Eagles | |||
| Regional Exchange Rates | |||
| Gross Domestic Product: | $8,139,320,000,000.00 - 46% | ||
| Black & Grey Markets Combined: | $9,519,561,216,027.84 - 54% | ||
| Real Total Economy: | $17,658,881,216,027.84 | ||
| British Territories Economic Statistics & Links | |||
| Gross Regional Product: | $181,715,419,004,928 | ||
| Region Wide Imports: | $25,238,890,872,832 | ||
| Largest Regional GDP: | Sweeze 23 | ||
| Largest Regional Importer: | Sweeze 23 | ||
| Regional Search Functions: | All British Territories Nations. | ||
| Regional Nations by GDP | Regional Trading Leaders | |||
| Regional Exchange Rates | WA Members | |||
| Returns to standard Version: | FAQ | About | About | 589,129,283 uses since September 1, 2011. | |
Version 3.69 HTML4. V 0.7 is HTML1. |
Like our Calculator? Tell your friends for us... |