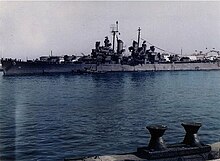
The Borderlands of USS Wilkes-Barre
Hummanty is at risk we must FIGHT
Region: Reserve Fleet
Quicksearch Query: USS Wilkes-Barre
|
Quicksearch: | |
NS Economy Mobile Home |
Regions Search |
USS Wilkes-Barre NS Page |
|
| GDP Leaders | Export Leaders | Interesting Places BIG Populations | Most Worked | | Militaristic States | Police States | |

Hummanty is at risk we must FIGHT
Region: Reserve Fleet
Quicksearch Query: USS Wilkes-Barre
| USS Wilkes-Barre Domestic Statistics | |||
|---|---|---|---|
| Government Category: | Borderlands | ||
| Government Priority: | Law & Order | ||
| Economic Rating: | Good | ||
| Civil Rights Rating: | Some | ||
| Political Freedoms: | Average | ||
| Income Tax Rate: | 29% | ||
| Consumer Confidence Rate: | 98% | ||
| Worker Enthusiasm Rate: | 100% | ||
| Major Industry: | Woodchip Exports | ||
| National Animal: | Kitsune | ||
| USS Wilkes-Barre Demographics | |||
| Total Population: | 3,637,000,000 | ||
| Criminals: | 399,144,225 | ||
| Elderly, Disabled, & Retirees: | 485,137,858 | ||
| Military & Reserves: ? | 111,894,028 | ||
| Students and Youth: | 629,382,850 | ||
| Unemployed but Able: | 569,251,342 | ||
| Working Class: | 1,442,189,697 | ||
| USS Wilkes-Barre Government Budget Details | |||
| Government Budget: | $10,611,401,776,881.99 | ||
| Government Expenditures: | $10,186,945,705,806.71 | ||
| Goverment Waste: | $424,456,071,075.28 | ||
| Goverment Efficiency: | 96% | ||
| USS Wilkes-Barre Government Spending Breakdown: | |||
| Administration: | $1,018,694,570,580.67 | 10% | |
| Social Welfare: | $1,120,564,027,638.74 | 11% | |
| Healthcare: | $1,426,172,398,812.94 | 14% | |
| Education: | $916,825,113,522.60 | 9% | |
| Religion & Spirituality: | $509,347,285,290.34 | 5% | |
| Defense: | $1,222,433,484,696.81 | 12% | |
| Law & Order: | $1,629,911,312,929.07 | 16% | |
| Commerce: | $509,347,285,290.34 | 5% | |
| Public Transport: | $814,955,656,464.54 | 8% | |
| The Environment: | $305,608,371,174.20 | 3% | |
| Social Equality: | $509,347,285,290.34 | 5% | |
| USS Wilkes-BarreWhite Market Economic Statistics ? | |||
| Gross Domestic Product: | $8,616,930,000,000.00 | ||
| GDP Per Capita: | $2,369.24 | ||
| Average Salary Per Employee: | $3,806.01 | ||
| Unemployment Rate: | 23.70% | ||
| Consumption: | $19,002,459,800,207.36 | ||
| Exports: | $3,705,532,735,488.00 | ||
| Imports: | $3,723,232,804,864.00 | ||
| Trade Net: | -17,700,069,376.00 | ||
| USS Wilkes-Barre Non Market Statistics ? Evasion, Black Market, Barter & Crime | |||
| Black & Grey Markets Combined: | $24,184,358,379,469.08 | ||
| Avg Annual Criminal's Income / Savings: ? | $4,950.21 | ||
| Recovered Product + Fines & Fees: | $2,902,123,005,536.29 | ||
| Black Market & Non Monetary Trade: | |||
| Guns & Weapons: | $803,670,413,308.14 | ||
| Drugs and Pharmaceuticals: | $1,273,741,787,129.88 | ||
| Extortion & Blackmail: | $909,815,562,235.63 | ||
| Counterfeit Goods: | $1,637,668,012,024.13 | ||
| Trafficking & Intl Sales: | $727,852,449,788.50 | ||
| Theft & Disappearance: | $1,152,433,045,498.46 | ||
| Counterfeit Currency & Instruments : | $1,940,939,866,102.67 | ||
| Illegal Mining, Logging, and Hunting : | $424,580,595,709.96 | ||
| Basic Necessitites : | $1,091,778,674,682.75 | ||
| School Loan Fraud : | $636,870,893,564.94 | ||
| Tax Evasion + Barter Trade : | $10,399,274,103,171.70 | ||
| USS Wilkes-Barre Total Market Statistics ? | |||
| National Currency: | Delta Eagle | ||
| Exchange Rates: | 1 Delta Eagle = $0.21 | ||
| $1 = 4.77 Delta Eagles | |||
| Regional Exchange Rates | |||
| Gross Domestic Product: | $8,616,930,000,000.00 - 26% | ||
| Black & Grey Markets Combined: | $24,184,358,379,469.08 - 74% | ||
| Real Total Economy: | $32,801,288,379,469.08 | ||
| Reserve Fleet Economic Statistics & Links | |||
| Gross Regional Product: | $878,401,611,104,256 | ||
| Region Wide Imports: | $121,616,444,948,480 | ||
| Largest Regional GDP: | USS Los Angeles | ||
| Largest Regional Importer: | USS Los Angeles | ||
| Regional Search Functions: | All Reserve Fleet Nations. | ||
| Regional Nations by GDP | Regional Trading Leaders | |||
| Regional Exchange Rates | WA Members | |||
| Returns to standard Version: | FAQ | About | About | 596,299,093 uses since September 1, 2011. | |
Version 3.69 HTML4. V 0.7 is HTML1. |
Like our Calculator? Tell your friends for us... |