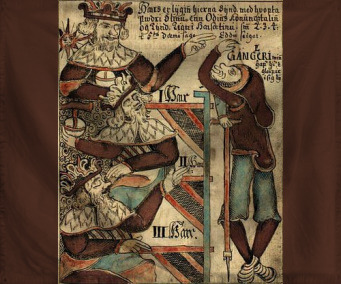
The Democratic Republic of Gangleri
Hver er lei? til himins af j?r?u?
|
Quicksearch: | |
NS Economy Mobile Home |
Regions Search |
Gangleri NS Page |
|
| GDP Leaders | Export Leaders | Interesting Places BIG Populations | Most Worked | | Militaristic States | Police States | |

Hver er lei? til himins af j?r?u?
| Gangleri Domestic Statistics | |||
|---|---|---|---|
| Government Category: | Democratic Republic | ||
| Government Priority: | Religion & Spirituality | ||
| Economic Rating: | Very Strong | ||
| Civil Rights Rating: | Average | ||
| Political Freedoms: | Very Good | ||
| Income Tax Rate: | 21% | ||
| Consumer Confidence Rate: | 101% | ||
| Worker Enthusiasm Rate: | 103% | ||
| Major Industry: | Book Publishing | ||
| National Animal: | raven | ||
| Gangleri Demographics | |||
| Total Population: | 2,188,000,000 | ||
| Criminals: | 224,880,421 | ||
| Elderly, Disabled, & Retirees: | 297,860,581 | ||
| Military & Reserves: ? | 0 | ||
| Students and Youth: | 375,351,400 | ||
| Unemployed but Able: | 333,170,506 | ||
| Working Class: | 956,737,092 | ||
| Gangleri Government Budget Details | |||
| Government Budget: | $11,161,271,956,631.71 | ||
| Government Expenditures: | $10,826,433,797,932.76 | ||
| Goverment Waste: | $334,838,158,698.95 | ||
| Goverment Efficiency: | 97% | ||
| Gangleri Government Spending Breakdown: | |||
| Administration: | $1,515,700,731,710.59 | 14% | |
| Social Welfare: | $1,082,643,379,793.28 | 10% | |
| Healthcare: | $974,379,041,813.95 | 9% | |
| Education: | $1,190,907,717,772.60 | 11% | |
| Religion & Spirituality: | $2,490,079,773,524.54 | 23% | |
| Defense: | $0.00 | 0% | |
| Law & Order: | $216,528,675,958.66 | 2% | |
| Commerce: | $974,379,041,813.95 | 9% | |
| Public Transport: | $757,850,365,855.29 | 7% | |
| The Environment: | $324,793,013,937.98 | 3% | |
| Social Equality: | $649,586,027,875.97 | 6% | |
| GangleriWhite Market Economic Statistics ? | |||
| Gross Domestic Product: | $9,054,450,000,000.00 | ||
| GDP Per Capita: | $4,138.23 | ||
| Average Salary Per Employee: | $6,399.43 | ||
| Unemployment Rate: | 21.92% | ||
| Consumption: | $26,993,639,460,700.16 | ||
| Exports: | $4,343,906,762,752.00 | ||
| Imports: | $4,680,781,922,304.00 | ||
| Trade Net: | -336,875,159,552.00 | ||
| Gangleri Non Market Statistics ? Evasion, Black Market, Barter & Crime | |||
| Black & Grey Markets Combined: | $11,180,715,627,637.84 | ||
| Avg Annual Criminal's Income / Savings: ? | $3,236.88 | ||
| Recovered Product + Fines & Fees: | $167,710,734,414.57 | ||
| Black Market & Non Monetary Trade: | |||
| Guns & Weapons: | $180,475,617,687.70 | ||
| Drugs and Pharmaceuticals: | $816,063,662,587.85 | ||
| Extortion & Blackmail: | $721,902,470,750.79 | ||
| Counterfeit Goods: | $345,257,703,402.55 | ||
| Trafficking & Intl Sales: | $627,741,278,913.73 | ||
| Theft & Disappearance: | $470,805,959,185.30 | ||
| Counterfeit Currency & Instruments : | $502,193,023,130.98 | ||
| Illegal Mining, Logging, and Hunting : | $204,015,915,646.96 | ||
| Basic Necessitites : | $580,660,682,995.20 | ||
| School Loan Fraud : | $392,338,299,321.08 | ||
| Tax Evasion + Barter Trade : | $4,807,707,719,884.27 | ||
| Gangleri Total Market Statistics ? | |||
| National Currency: | krona | ||
| Exchange Rates: | 1 krona = $0.39 | ||
| $1 = 2.55 kronas | |||
| Regional Exchange Rates | |||
| Gross Domestic Product: | $9,054,450,000,000.00 - 45% | ||
| Black & Grey Markets Combined: | $11,180,715,627,637.84 - 55% | ||
| Real Total Economy: | $20,235,165,627,637.84 | ||
| Lazarus Economic Statistics & Links | |||
| Gross Regional Product: | $2,231,160,193,725,497,344 | ||
| Region Wide Imports: | $283,646,151,398,260,736 | ||
| Largest Regional GDP: | Celdonia | ||
| Largest Regional Importer: | MegaTokyo-3 | ||
| Regional Search Functions: | All Lazarus Nations. | ||
| Regional Nations by GDP | Regional Trading Leaders | |||
| Regional Exchange Rates | WA Members | |||
| Returns to standard Version: | FAQ | About | About | 598,009,602 uses since September 1, 2011. | |
Version 3.69 HTML4. V 0.7 is HTML1. |
Like our Calculator? Tell your friends for us... |