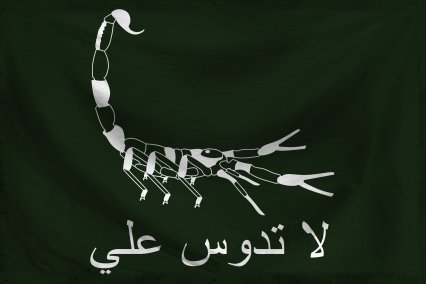
The Emirate of Mosul
الله أكبر
|
Quicksearch: | |
NS Economy Mobile Home |
Regions Search |
Mosul NS Page |
|
| GDP Leaders | Export Leaders | Interesting Places BIG Populations | Most Worked | | Militaristic States | Police States | |
| Mosul Domestic Statistics | |||
|---|---|---|---|
| Government Category: | Emirate | ||
| Government Priority: | Social Welfare | ||
| Economic Rating: | Fair | ||
| Civil Rights Rating: | Average | ||
| Political Freedoms: | Excellent | ||
| Income Tax Rate: | 52% | ||
| Consumer Confidence Rate: | 99% | ||
| Worker Enthusiasm Rate: | 102% | ||
| Major Industry: | Arms Manufacturing | ||
| National Animal: | scorpion | ||
| Mosul Demographics | |||
| Total Population: | 4,196,000,000 | ||
| Criminals: | 455,660,312 | ||
| Elderly, Disabled, & Retirees: | 525,629,749 | ||
| Military & Reserves: ? | 139,234,930 | ||
| Students and Youth: | 769,546,400 | ||
| Unemployed but Able: | 660,100,329 | ||
| Working Class: | 1,645,828,279 | ||
| Mosul Government Budget Details | |||
| Government Budget: | $10,725,821,379,363.47 | ||
| Government Expenditures: | $10,511,304,951,776.20 | ||
| Goverment Waste: | $214,516,427,587.27 | ||
| Goverment Efficiency: | 98% | ||
| Mosul Government Spending Breakdown: | |||
| Administration: | $630,678,297,106.57 | 6% | |
| Social Welfare: | $1,471,582,693,248.67 | 14% | |
| Healthcare: | $840,904,396,142.10 | 8% | |
| Education: | $946,017,445,659.86 | 9% | |
| Religion & Spirituality: | $1,366,469,643,730.91 | 13% | |
| Defense: | $1,366,469,643,730.91 | 13% | |
| Law & Order: | $946,017,445,659.86 | 9% | |
| Commerce: | $735,791,346,624.33 | 7% | |
| Public Transport: | $630,678,297,106.57 | 6% | |
| The Environment: | $630,678,297,106.57 | 6% | |
| Social Equality: | $630,678,297,106.57 | 6% | |
| MosulWhite Market Economic Statistics ? | |||
| Gross Domestic Product: | $8,578,220,000,000.00 | ||
| GDP Per Capita: | $2,044.38 | ||
| Average Salary Per Employee: | $3,421.07 | ||
| Unemployment Rate: | 24.03% | ||
| Consumption: | $8,151,223,479,828.48 | ||
| Exports: | $2,189,493,600,256.00 | ||
| Imports: | $2,356,482,932,736.00 | ||
| Trade Net: | -166,989,332,480.00 | ||
| Mosul Non Market Statistics ? Evasion, Black Market, Barter & Crime | |||
| Black & Grey Markets Combined: | $26,794,592,992,245.36 | ||
| Avg Annual Criminal's Income / Savings: ? | $4,537.34 | ||
| Recovered Product + Fines & Fees: | $1,808,635,026,976.56 | ||
| Black Market & Non Monetary Trade: | |||
| Guns & Weapons: | $1,157,162,178,266.51 | ||
| Drugs and Pharmaceuticals: | $1,352,989,623,819.31 | ||
| Extortion & Blackmail: | $925,729,742,613.21 | ||
| Counterfeit Goods: | $1,602,224,554,522.86 | ||
| Trafficking & Intl Sales: | $1,103,754,693,115.75 | ||
| Theft & Disappearance: | $996,939,722,814.23 | ||
| Counterfeit Currency & Instruments : | $1,531,014,574,321.85 | ||
| Illegal Mining, Logging, and Hunting : | $640,889,821,809.15 | ||
| Basic Necessitites : | $1,531,014,574,321.85 | ||
| School Loan Fraud : | $854,519,762,412.19 | ||
| Tax Evasion + Barter Trade : | $11,521,674,986,665.50 | ||
| Mosul Total Market Statistics ? | |||
| National Currency: | dinar | ||
| Exchange Rates: | 1 dinar = $0.14 | ||
| $1 = 7.03 dinars | |||
| Regional Exchange Rates | |||
| Gross Domestic Product: | $8,578,220,000,000.00 - 24% | ||
| Black & Grey Markets Combined: | $26,794,592,992,245.36 - 76% | ||
| Real Total Economy: | $35,372,812,992,245.36 | ||
| Syria Economic Statistics & Links | |||
| Gross Regional Product: | $2,463,020,936,593,408 | ||
| Region Wide Imports: | $317,563,238,088,704 | ||
| Largest Regional GDP: | Al-Syria | ||
| Largest Regional Importer: | Al-Syria | ||
| Regional Search Functions: | All Syria Nations. | ||
| Regional Nations by GDP | Regional Trading Leaders | |||
| Regional Exchange Rates | WA Members | |||
| Returns to standard Version: | FAQ | About | About | 595,580,321 uses since September 1, 2011. | |
Version 3.69 HTML4. V 0.7 is HTML1. |
Like our Calculator? Tell your friends for us... |