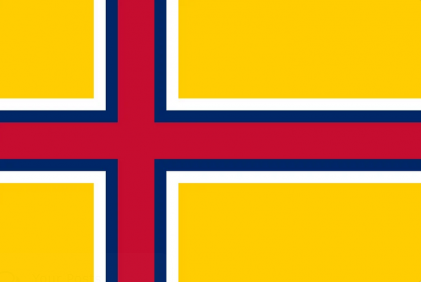
The Viking territories of Norway-Sweden-Finland
Guardians of Freedom, United by Nature
Region: The Frontier Sea
Quicksearch Query: Norway-Sweden-Finland
|
Quicksearch: | |
NS Economy Mobile Home |
Regions Search |
Norway-Sweden-Finland NS Page |
|
| GDP Leaders | Export Leaders | Interesting Places BIG Populations | Most Worked | | Militaristic States | Police States | |

Guardians of Freedom, United by Nature
Region: The Frontier Sea
Quicksearch Query: Norway-Sweden-Finland
| Norway-Sweden-Finland Domestic Statistics | |||
|---|---|---|---|
| Government Category: | Viking territories | ||
| Government Priority: | Defence | ||
| Economic Rating: | All-Consuming | ||
| Civil Rights Rating: | Some | ||
| Political Freedoms: | Below Average | ||
| Income Tax Rate: | 67% | ||
| Consumer Confidence Rate: | 101% | ||
| Worker Enthusiasm Rate: | 102% | ||
| Major Industry: | Arms Manufacturing | ||
| National Animal: | great kraken | ||
| Norway-Sweden-Finland Demographics | |||
| Total Population: | 8,545,000,000 | ||
| Criminals: | 573,971,439 | ||
| Elderly, Disabled, & Retirees: | 969,973,897 | ||
| Military & Reserves: ? | 615,802,322 | ||
| Students and Youth: | 1,653,457,500 | ||
| Unemployed but Able: | 1,071,192,150 | ||
| Working Class: | 3,660,602,692 | ||
| Norway-Sweden-Finland Government Budget Details | |||
| Government Budget: | $200,341,021,159,902.41 | ||
| Government Expenditures: | $190,323,970,101,907.28 | ||
| Goverment Waste: | $10,017,051,057,995.12 | ||
| Goverment Efficiency: | 95% | ||
| Norway-Sweden-Finland Government Spending Breakdown: | |||
| Administration: | $22,838,876,412,228.87 | 12% | |
| Social Welfare: | $3,806,479,402,038.15 | 2% | |
| Healthcare: | $19,032,397,010,190.73 | 10% | |
| Education: | $19,032,397,010,190.73 | 10% | |
| Religion & Spirituality: | $0.00 | 0% | |
| Defense: | $45,677,752,824,457.74 | 24% | |
| Law & Order: | $28,548,595,515,286.09 | 15% | |
| Commerce: | $17,129,157,309,171.65 | 9% | |
| Public Transport: | $5,709,719,103,057.22 | 3% | |
| The Environment: | $22,838,876,412,228.87 | 12% | |
| Social Equality: | $5,709,719,103,057.22 | 3% | |
| Norway-Sweden-FinlandWhite Market Economic Statistics ? | |||
| Gross Domestic Product: | $154,420,000,000,000.00 | ||
| GDP Per Capita: | $18,071.39 | ||
| Average Salary Per Employee: | $28,247.88 | ||
| Unemployment Rate: | 10.63% | ||
| Consumption: | $87,372,434,642,042.89 | ||
| Exports: | $33,945,305,055,232.00 | ||
| Imports: | $34,370,287,042,560.00 | ||
| Trade Net: | -424,981,987,328.00 | ||
| Norway-Sweden-Finland Non Market Statistics ? Evasion, Black Market, Barter & Crime | |||
| Black & Grey Markets Combined: | $545,766,268,966,799.69 | ||
| Avg Annual Criminal's Income / Savings: ? | $87,075.06 | ||
| Recovered Product + Fines & Fees: | $61,398,705,258,764.96 | ||
| Black Market & Non Monetary Trade: | |||
| Guns & Weapons: | $33,130,741,357,629.57 | ||
| Drugs and Pharmaceuticals: | $20,706,713,348,518.48 | ||
| Extortion & Blackmail: | $28,989,398,687,925.88 | ||
| Counterfeit Goods: | $49,696,112,036,444.36 | ||
| Trafficking & Intl Sales: | $12,424,028,009,111.09 | ||
| Theft & Disappearance: | $17,945,818,235,382.69 | ||
| Counterfeit Currency & Instruments : | $53,837,454,706,148.06 | ||
| Illegal Mining, Logging, and Hunting : | $18,636,042,013,666.64 | ||
| Basic Necessitites : | $11,733,804,230,827.14 | ||
| School Loan Fraud : | $22,087,160,905,086.38 | ||
| Tax Evasion + Barter Trade : | $234,679,495,655,723.88 | ||
| Norway-Sweden-Finland Total Market Statistics ? | |||
| National Currency: | ounces of silver | ||
| Exchange Rates: | 1 ounces of silver = $1.16 | ||
| $1 = 0.86 ounces of silvers | |||
| Regional Exchange Rates | |||
| Gross Domestic Product: | $154,420,000,000,000.00 - 22% | ||
| Black & Grey Markets Combined: | $545,766,268,966,799.69 - 78% | ||
| Real Total Economy: | $700,186,268,966,799.75 | ||
| The Frontier Sea Economic Statistics & Links | |||
| Gross Regional Product: | $16,862,909,187,489,792 | ||
| Region Wide Imports: | $2,161,980,236,365,824 | ||
| Largest Regional GDP: | Eaglais Bhreac | ||
| Largest Regional Importer: | Eaglais Bhreac | ||
| Regional Search Functions: | All The Frontier Sea Nations. | ||
| Regional Nations by GDP | Regional Trading Leaders | |||
| Regional Exchange Rates | WA Members | |||
| Returns to standard Version: | FAQ | About | About | 595,000,563 uses since September 1, 2011. | |
Version 3.69 HTML4. V 0.7 is HTML1. |
Like our Calculator? Tell your friends for us... |