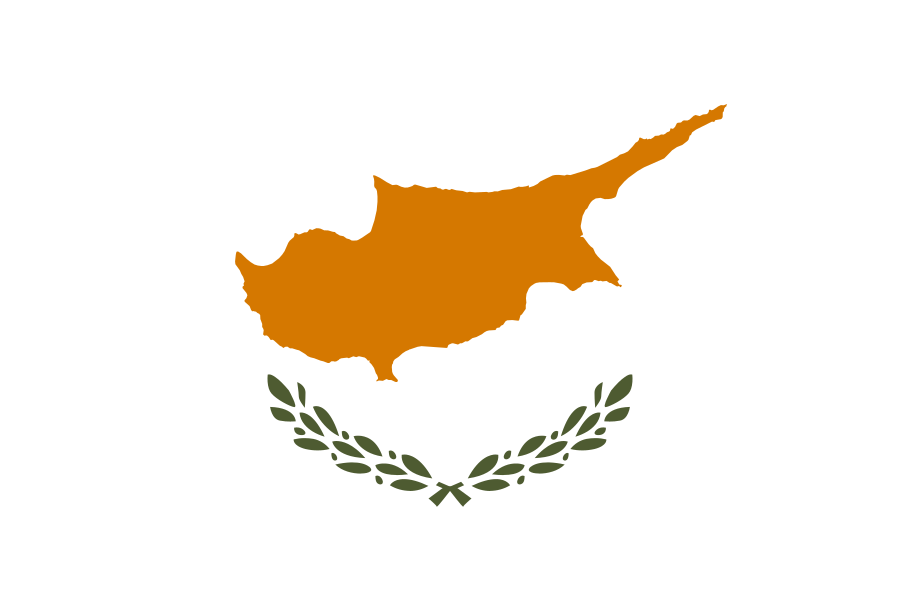
The Sultanate of Runpan
Strength Through Freedom
Region: The Wave Experience
Quicksearch Query: Runpan
|
Quicksearch: | |
NS Economy Mobile Home |
Regions Search |
Runpan NS Page |
|
| GDP Leaders | Export Leaders | Interesting Places BIG Populations | Most Worked | | Militaristic States | Police States | |
Strength Through Freedom
Region: The Wave Experience
Quicksearch Query: Runpan
| Runpan Domestic Statistics | |||
|---|---|---|---|
| Government Category: | Sultanate | ||
| Government Priority: | Defence | ||
| Economic Rating: | Struggling | ||
| Civil Rights Rating: | Excellent | ||
| Political Freedoms: | Superb | ||
| Income Tax Rate: | 54% | ||
| Consumer Confidence Rate: | 99% | ||
| Worker Enthusiasm Rate: | 101% | ||
| Major Industry: | Uranium Mining | ||
| National Animal: | tiger | ||
| Runpan Demographics | |||
| Total Population: | 1,311,000,000 | ||
| Criminals: | 150,018,012 | ||
| Elderly, Disabled, & Retirees: | 148,818,781 | ||
| Military & Reserves: ? | 58,808,308 | ||
| Students and Youth: | 255,776,100 | ||
| Unemployed but Able: | 211,865,739 | ||
| Working Class: | 485,713,061 | ||
| Runpan Government Budget Details | |||
| Government Budget: | $555,872,538,073.83 | ||
| Government Expenditures: | $544,755,087,312.35 | ||
| Goverment Waste: | $11,117,450,761.48 | ||
| Goverment Efficiency: | 98% | ||
| Runpan Government Spending Breakdown: | |||
| Administration: | $38,132,856,111.86 | 7% | |
| Social Welfare: | $70,818,161,350.61 | 13% | |
| Healthcare: | $59,923,059,604.36 | 11% | |
| Education: | $70,818,161,350.61 | 13% | |
| Religion & Spirituality: | $0.00 | 0% | |
| Defense: | $98,055,915,716.22 | 18% | |
| Law & Order: | $54,475,508,731.23 | 10% | |
| Commerce: | $32,685,305,238.74 | 6% | |
| Public Transport: | $43,580,406,984.99 | 8% | |
| The Environment: | $27,237,754,365.62 | 5% | |
| Social Equality: | $49,027,957,858.11 | 9% | |
| RunpanWhite Market Economic Statistics ? | |||
| Gross Domestic Product: | $450,752,000,000.00 | ||
| GDP Per Capita: | $343.82 | ||
| Average Salary Per Employee: | $603.15 | ||
| Unemployment Rate: | 25.83% | ||
| Consumption: | $392,803,557,048.32 | ||
| Exports: | $116,604,642,432.00 | ||
| Imports: | $118,384,312,320.00 | ||
| Trade Net: | -1,779,669,888.00 | ||
| Runpan Non Market Statistics ? Evasion, Black Market, Barter & Crime | |||
| Black & Grey Markets Combined: | $1,403,753,347,504.13 | ||
| Avg Annual Criminal's Income / Savings: ? | $764.48 | ||
| Recovered Product + Fines & Fees: | $105,281,501,062.81 | ||
| Black Market & Non Monetary Trade: | |||
| Guns & Weapons: | $66,611,605,722.44 | ||
| Drugs and Pharmaceuticals: | $64,761,283,341.26 | ||
| Extortion & Blackmail: | $48,108,381,910.65 | ||
| Counterfeit Goods: | $92,516,119,058.94 | ||
| Trafficking & Intl Sales: | $38,856,770,004.76 | ||
| Theft & Disappearance: | $74,012,895,247.16 | ||
| Counterfeit Currency & Instruments : | $96,216,763,821.30 | ||
| Illegal Mining, Logging, and Hunting : | $33,305,802,861.22 | ||
| Basic Necessitites : | $88,815,474,296.59 | ||
| School Loan Fraud : | $57,359,993,816.55 | ||
| Tax Evasion + Barter Trade : | $603,613,939,426.78 | ||
| Runpan Total Market Statistics ? | |||
| National Currency: | shell | ||
| Exchange Rates: | 1 shell = $0.02 | ||
| $1 = 42.52 shells | |||
| Regional Exchange Rates | |||
| Gross Domestic Product: | $450,752,000,000.00 - 24% | ||
| Black & Grey Markets Combined: | $1,403,753,347,504.13 - 76% | ||
| Real Total Economy: | $1,854,505,347,504.13 | ||
| The Wave Experience Economic Statistics & Links | |||
| Gross Regional Product: | $341,630,993,301,504 | ||
| Region Wide Imports: | $46,650,416,431,104 | ||
| Largest Regional GDP: | Wirola | ||
| Largest Regional Importer: | Wirola | ||
| Regional Search Functions: | All The Wave Experience Nations. | ||
| Regional Nations by GDP | Regional Trading Leaders | |||
| Regional Exchange Rates | WA Members | |||
| Returns to standard Version: | FAQ | About | About | 674,135,285 uses since September 1, 2011. | |
Version 3.69 HTML4. V 0.7 is HTML1. |
Like our Calculator? Tell your friends for us... |