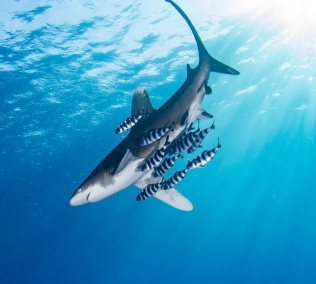
The Community of Shark
Selachimorpha
|
Quicksearch: | |
NS Economy Mobile Home |
Regions Search |
Shark NS Page |
|
| GDP Leaders | Export Leaders | Interesting Places BIG Populations | Most Worked | | Militaristic States | Police States | |
| Shark Domestic Statistics | |||
|---|---|---|---|
| Government Category: | Community | ||
| Government Priority: | Law & Order | ||
| Economic Rating: | Very Strong | ||
| Civil Rights Rating: | Few | ||
| Political Freedoms: | Good | ||
| Income Tax Rate: | 24% | ||
| Consumer Confidence Rate: | 97% | ||
| Worker Enthusiasm Rate: | 100% | ||
| Major Industry: | Uranium Mining | ||
| National Animal: | Shark | ||
| Shark Demographics | |||
| Total Population: | 7,451,000,000 | ||
| Criminals: | 774,231,552 | ||
| Elderly, Disabled, & Retirees: | 967,224,262 | ||
| Military & Reserves: ? | 273,613,886 | ||
| Students and Youth: | 1,317,336,800 | ||
| Unemployed but Able: | 1,134,899,217 | ||
| Working Class: | 2,983,694,283 | ||
| Shark Government Budget Details | |||
| Government Budget: | $37,713,030,438,998.50 | ||
| Government Expenditures: | $36,204,509,221,438.56 | ||
| Goverment Waste: | $1,508,521,217,559.94 | ||
| Goverment Efficiency: | 96% | ||
| Shark Government Spending Breakdown: | |||
| Administration: | $2,896,360,737,715.09 | 8% | |
| Social Welfare: | $3,982,496,014,358.24 | 11% | |
| Healthcare: | $4,344,541,106,572.63 | 12% | |
| Education: | $5,068,631,291,001.40 | 14% | |
| Religion & Spirituality: | $0.00 | 0% | |
| Defense: | $5,068,631,291,001.40 | 14% | |
| Law & Order: | $5,430,676,383,215.78 | 15% | |
| Commerce: | $4,706,586,198,787.01 | 13% | |
| Public Transport: | $724,090,184,428.77 | 2% | |
| The Environment: | $2,896,360,737,715.09 | 8% | |
| Social Equality: | $1,086,135,276,643.16 | 3% | |
| SharkWhite Market Economic Statistics ? | |||
| Gross Domestic Product: | $30,696,500,000,000.00 | ||
| GDP Per Capita: | $4,119.78 | ||
| Average Salary Per Employee: | $6,486.64 | ||
| Unemployment Rate: | 21.94% | ||
| Consumption: | $82,475,549,993,205.77 | ||
| Exports: | $14,995,071,401,984.00 | ||
| Imports: | $15,294,144,708,608.00 | ||
| Trade Net: | -299,073,306,624.00 | ||
| Shark Non Market Statistics ? Evasion, Black Market, Barter & Crime | |||
| Black & Grey Markets Combined: | $81,509,952,861,768.88 | ||
| Avg Annual Criminal's Income / Savings: ? | $8,686.35 | ||
| Recovered Product + Fines & Fees: | $9,169,869,696,949.00 | ||
| Black Market & Non Monetary Trade: | |||
| Guns & Weapons: | $2,886,369,318,276.31 | ||
| Drugs and Pharmaceuticals: | $3,917,215,503,375.00 | ||
| Extortion & Blackmail: | $4,329,553,977,414.47 | ||
| Counterfeit Goods: | $7,215,923,295,690.78 | ||
| Trafficking & Intl Sales: | $1,237,015,422,118.42 | ||
| Theft & Disappearance: | $3,092,538,555,296.05 | ||
| Counterfeit Currency & Instruments : | $6,185,077,110,592.10 | ||
| Illegal Mining, Logging, and Hunting : | $1,855,523,133,177.63 | ||
| Basic Necessitites : | $4,020,300,121,884.87 | ||
| School Loan Fraud : | $3,711,046,266,355.26 | ||
| Tax Evasion + Barter Trade : | $35,049,279,730,560.62 | ||
| Shark Total Market Statistics ? | |||
| National Currency: | mark | ||
| Exchange Rates: | 1 mark = $0.39 | ||
| $1 = 2.56 marks | |||
| Regional Exchange Rates | |||
| Gross Domestic Product: | $30,696,500,000,000.00 - 27% | ||
| Black & Grey Markets Combined: | $81,509,952,861,768.88 - 73% | ||
| Real Total Economy: | $112,206,452,861,768.88 | ||
| Safari Economic Statistics & Links | |||
| Gross Regional Product: | $11,894,179,634,348,032 | ||
| Region Wide Imports: | $1,643,506,414,125,056 | ||
| Largest Regional GDP: | Apexiala Wildlife Reserve | ||
| Largest Regional Importer: | Apexiala Wildlife Reserve | ||
| Regional Search Functions: | All Safari Nations. | ||
| Regional Nations by GDP | Regional Trading Leaders | |||
| Regional Exchange Rates | WA Members | |||
| Returns to standard Version: | FAQ | About | About | 592,544,600 uses since September 1, 2011. | |
Version 3.69 HTML4. V 0.7 is HTML1. |
Like our Calculator? Tell your friends for us... |