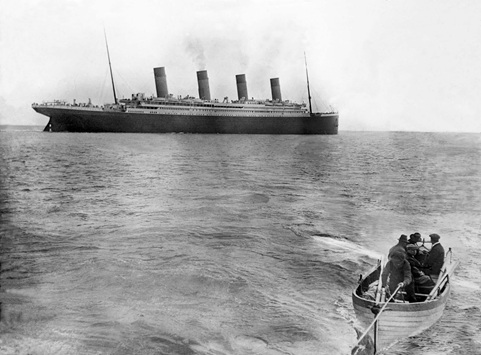
The Sinking of Titanic
This ship can't sink.
Region: 10000 Islands
Quicksearch Query: Titanic
|
Quicksearch: | |
NS Economy Mobile Home |
Regions Search |
Titanic NS Page |
|
| GDP Leaders | Export Leaders | Interesting Places BIG Populations | Most Worked | | Militaristic States | Police States | |
| Titanic Domestic Statistics | |||
|---|---|---|---|
| Government Category: | Sinking | ||
| Government Priority: | Commerce | ||
| Economic Rating: | Powerhouse | ||
| Civil Rights Rating: | Rare | ||
| Political Freedoms: | Average | ||
| Income Tax Rate: | 5% | ||
| Consumer Confidence Rate: | 96% | ||
| Worker Enthusiasm Rate: | 100% | ||
| Major Industry: | Book Publishing | ||
| National Animal: | Dolphin | ||
| Titanic Demographics | |||
| Total Population: | 18,796,000,000 | ||
| Criminals: | 2,015,846,021 | ||
| Elderly, Disabled, & Retirees: | 2,753,859,438 | ||
| Military & Reserves: ? | 1,849,270,473 | ||
| Students and Youth: | 3,007,360,000 | ||
| Unemployed but Able: | 2,908,099,135 | ||
| Working Class: | 6,261,564,933 | ||
| Titanic Government Budget Details | |||
| Government Budget: | $74,068,045,337,009.84 | ||
| Government Expenditures: | $71,105,323,523,529.45 | ||
| Goverment Waste: | $2,962,721,813,480.39 | ||
| Goverment Efficiency: | 96% | ||
| Titanic Government Spending Breakdown: | |||
| Administration: | $0.00 | 0% | |
| Social Welfare: | $0.00 | 0% | |
| Healthcare: | $0.00 | 0% | |
| Education: | $0.00 | 0% | |
| Religion & Spirituality: | $0.00 | 0% | |
| Defense: | $27,020,022,938,941.19 | 38% | |
| Law & Order: | $0.00 | 0% | |
| Commerce: | $44,796,353,819,823.55 | 63% | |
| Public Transport: | $0.00 | 0% | |
| The Environment: | $0.00 | 0% | |
| Social Equality: | $0.00 | 0% | |
| TitanicWhite Market Economic Statistics ? | |||
| Gross Domestic Product: | $58,435,200,000,000.00 | ||
| GDP Per Capita: | $3,108.92 | ||
| Average Salary Per Employee: | $5,823.39 | ||
| Unemployment Rate: | 22.94% | ||
| Consumption: | $428,634,521,626,214.38 | ||
| Exports: | $56,912,417,128,448.00 | ||
| Imports: | $65,070,562,279,424.00 | ||
| Trade Net: | -8,158,145,150,976.00 | ||
| Titanic Non Market Statistics ? Evasion, Black Market, Barter & Crime | |||
| Black & Grey Markets Combined: | $72,496,079,683,630.53 | ||
| Avg Annual Criminal's Income / Savings: ? | $3,257.53 | ||
| Recovered Product + Fines & Fees: | $0.00 | ||
| Black Market & Non Monetary Trade: | |||
| Guns & Weapons: | $7,851,325,429,737.19 | ||
| Drugs and Pharmaceuticals: | $0.00 | ||
| Extortion & Blackmail: | $13,016,671,107,195.86 | ||
| Counterfeit Goods: | $16,942,333,822,064.45 | ||
| Trafficking & Intl Sales: | $0.00 | ||
| Theft & Disappearance: | $0.00 | ||
| Counterfeit Currency & Instruments : | $3,925,662,714,868.59 | ||
| Illegal Mining, Logging, and Hunting : | $0.00 | ||
| Basic Necessitites : | $0.00 | ||
| School Loan Fraud : | $0.00 | ||
| Tax Evasion + Barter Trade : | $31,173,314,263,961.13 | ||
| Titanic Total Market Statistics ? | |||
| National Currency: | Pound | ||
| Exchange Rates: | 1 Pound = $0.44 | ||
| $1 = 2.28 Pounds | |||
| Regional Exchange Rates | |||
| Gross Domestic Product: | $58,435,200,000,000.00 - 45% | ||
| Black & Grey Markets Combined: | $72,496,079,683,630.53 - 55% | ||
| Real Total Economy: | $130,931,279,683,630.53 | ||
| 10000 Islands Economic Statistics & Links | |||
| Gross Regional Product: | $194,995,604,047,265,792 | ||
| Region Wide Imports: | $24,596,216,847,269,888 | ||
| Largest Regional GDP: | Titanica | ||
| Largest Regional Importer: | Wysterian Ambassadors | ||
| Regional Search Functions: | All 10000 Islands Nations. | ||
| Regional Nations by GDP | Regional Trading Leaders | |||
| Regional Exchange Rates | WA Members | |||
| Returns to standard Version: | FAQ | About | About | 601,973,459 uses since September 1, 2011. | |
Version 3.69 HTML4. V 0.7 is HTML1. |
Like our Calculator? Tell your friends for us... |