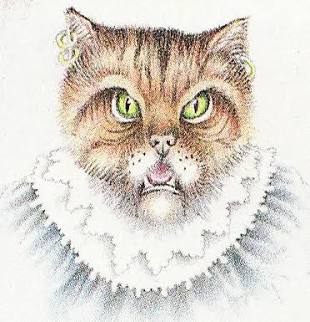
The Matriarchy of Tsarmina
They?re plotting against me!
|
Quicksearch: | |
NS Economy Mobile Home |
Regions Search |
Tsarmina NS Page |
|
| GDP Leaders | Export Leaders | Interesting Places BIG Populations | Most Worked | | Militaristic States | Police States | |

They?re plotting against me!
| Tsarmina Domestic Statistics | |||
|---|---|---|---|
| Government Category: | Matriarchy | ||
| Government Priority: | Defence | ||
| Economic Rating: | Weak | ||
| Civil Rights Rating: | Unheard Of | ||
| Political Freedoms: | Outlawed | ||
| Income Tax Rate: | 71% | ||
| Consumer Confidence Rate: | 90% | ||
| Worker Enthusiasm Rate: | 89% | ||
| Major Industry: | Arms Manufacturing | ||
| National Animal: | Wildcat | ||
| Tsarmina Demographics | |||
| Total Population: | 1,944,000,000 | ||
| Criminals: | 270,007,930 | ||
| Elderly, Disabled, & Retirees: | 204,827,956 | ||
| Military & Reserves: ? | 92,448,683 | ||
| Students and Youth: | 345,546,000 | ||
| Unemployed but Able: | 312,664,758 | ||
| Working Class: | 718,504,674 | ||
| Tsarmina Government Budget Details | |||
| Government Budget: | $2,055,023,542,874.93 | ||
| Government Expenditures: | $1,644,018,834,299.95 | ||
| Goverment Waste: | $411,004,708,574.99 | ||
| Goverment Efficiency: | 80% | ||
| Tsarmina Government Spending Breakdown: | |||
| Administration: | $131,521,506,744.00 | 8% | |
| Social Welfare: | $65,760,753,372.00 | 4% | |
| Healthcare: | $115,081,318,401.00 | 7% | |
| Education: | $82,200,941,715.00 | 5% | |
| Religion & Spirituality: | $246,602,825,144.99 | 15% | |
| Defense: | $312,363,578,516.99 | 19% | |
| Law & Order: | $263,043,013,487.99 | 16% | |
| Commerce: | $98,641,130,058.00 | 6% | |
| Public Transport: | $131,521,506,744.00 | 8% | |
| The Environment: | $98,641,130,058.00 | 6% | |
| Social Equality: | $82,200,941,715.00 | 5% | |
| TsarminaWhite Market Economic Statistics ? | |||
| Gross Domestic Product: | $1,252,470,000,000.00 | ||
| GDP Per Capita: | $644.27 | ||
| Average Salary Per Employee: | $907.58 | ||
| Unemployment Rate: | 25.51% | ||
| Consumption: | $905,984,839,516.16 | ||
| Exports: | $406,260,801,536.00 | ||
| Imports: | $354,186,625,024.00 | ||
| Trade Net: | 52,074,176,512.00 | ||
| Tsarmina Non Market Statistics ? Evasion, Black Market, Barter & Crime | |||
| Black & Grey Markets Combined: | $8,118,690,934,787.56 | ||
| Avg Annual Criminal's Income / Savings: ? | $2,637.57 | ||
| Recovered Product + Fines & Fees: | $974,242,912,174.51 | ||
| Black Market & Non Monetary Trade: | |||
| Guns & Weapons: | $463,228,148,666.17 | ||
| Drugs and Pharmaceuticals: | $346,148,506,695.60 | ||
| Extortion & Blackmail: | $285,063,476,102.26 | ||
| Counterfeit Goods: | $641,392,821,230.09 | ||
| Trafficking & Intl Sales: | $376,691,021,992.27 | ||
| Theft & Disappearance: | $244,340,122,373.37 | ||
| Counterfeit Currency & Instruments : | $682,116,174,958.98 | ||
| Illegal Mining, Logging, and Hunting : | $203,616,768,644.47 | ||
| Basic Necessitites : | $183,255,091,780.03 | ||
| School Loan Fraud : | $162,893,414,915.58 | ||
| Tax Evasion + Barter Trade : | $3,491,037,101,958.65 | ||
| Tsarmina Total Market Statistics ? | |||
| National Currency: | Kotir coins | ||
| Exchange Rates: | 1 Kotir coins = $0.06 | ||
| $1 = 17.71 Kotir coinss | |||
| Regional Exchange Rates | |||
| Gross Domestic Product: | $1,252,470,000,000.00 - 13% | ||
| Black & Grey Markets Combined: | $8,118,690,934,787.56 - 87% | ||
| Real Total Economy: | $9,371,160,934,787.56 | ||
| Loamhedge Economic Statistics & Links | |||
| Gross Regional Product: | $7,292,181,769,355,264 | ||
| Region Wide Imports: | $948,286,299,045,888 | ||
| Largest Regional GDP: | Zombiedolphins | ||
| Largest Regional Importer: | Zombiedolphins | ||
| Regional Search Functions: | All Loamhedge Nations. | ||
| Regional Nations by GDP | Regional Trading Leaders | |||
| Regional Exchange Rates | WA Members | |||
| Returns to standard Version: | FAQ | About | About | 596,257,372 uses since September 1, 2011. | |
Version 3.69 HTML4. V 0.7 is HTML1. |
Like our Calculator? Tell your friends for us... |