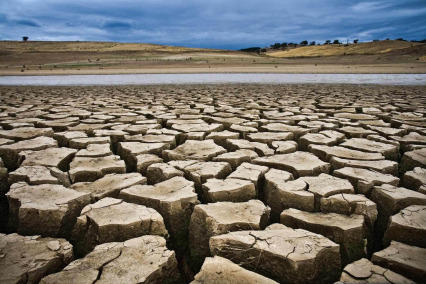
Barren grounds Domestic Statistics
| Government Category: |
Drought |
| Government Priority: |
Defence |
| Economic Rating: |
Frightening |
| Civil Rights Rating: |
Unheard Of |
| Political Freedoms: |
Rare |
| Income Tax Rate: |
38% |
| Consumer Confidence Rate: |
96% |
| Worker Enthusiasm Rate: |
95% |
| Major Industry: |
Arms Manufacturing |
| National Animal: |
cyanobacteria |
|
Barren grounds Demographics
| Total Population: |
34,914,000,000 |
| Criminals: |
3,154,935,574 |
| Elderly, Disabled, & Retirees: |
4,476,973,755 |
| Military & Reserves: ? |
2,262,658,758 |
| Students and Youth: |
6,050,596,200 |
| Unemployed but Able: |
4,835,416,512 |
| Working Class: |
14,133,419,200 |
|
|
|
Barren grounds Government Budget Details
| Government Budget: |
$502,098,162,582,395.25 |
| Government Expenditures: |
$451,888,346,324,155.75 |
| Goverment Waste: |
$50,209,816,258,239.50 |
| Goverment Efficiency: |
90% |
|
Barren grounds Government Spending Breakdown:
| Administration: |
$67,783,251,948,623.36 |
15% |
| Social Welfare: |
$18,075,533,852,966.23 |
4% |
| Healthcare: |
$45,188,834,632,415.58 |
10% |
| Education: |
$31,632,184,242,690.91 |
7% |
| Religion & Spirituality: |
$22,594,417,316,207.79 |
5% |
| Defense: |
$103,934,319,654,555.83 |
23% |
| Law & Order: |
$76,821,018,875,106.48 |
17% |
| Commerce: |
$63,264,368,485,381.81 |
14% |
| Public Transport: |
$13,556,650,389,724.67 |
3% |
| The Environment: |
$0.00 |
0% |
| Social Equality: |
$9,037,766,926,483.12 |
2% |
|
|
|
Barren grounds White Market Statistics ?
| Gross Domestic Product: |
$367,529,000,000,000.00 |
| GDP Per Capita: |
$10,526.69 |
| Average Salary Per Employee: |
$15,415.32 |
| Unemployment Rate: |
16.14% |
| Consumption: |
$692,125,753,545,850.88 |
| Exports: |
$149,446,744,866,816.00 |
| Imports: |
$148,964,884,086,784.00 |
| Trade Net: |
481,860,780,032.00 |
|
Barren grounds Grey and Black Market Statistics ?
Evasion, Black Market, Barter & Crime
| Black & Grey Markets Combined: |
$1,408,877,062,915,804.75 |
| Avg Annual Criminal's Income / Savings: ? |
$41,348.41 |
| Recovered Product + Fines & Fees: |
$179,631,825,521,765.09 |
|
Black Market & Grey Market Statistics:
| Guns & Weapons: |
$84,956,211,469,395.56 |
| Drugs and Pharmaceuticals: |
$56,053,582,825,168.21 |
| Extortion & Blackmail: |
$101,597,118,870,617.38 |
| Counterfeit Goods: |
$148,892,329,379,353.03 |
| Trafficking & Intl Sales: |
$19,268,419,096,151.57 |
| Theft & Disappearance: |
$42,040,187,118,876.15 |
| Counterfeit Currency & Instruments : |
$152,395,678,305,926.06 |
| Illegal Mining, Logging, and Hunting : |
$5,255,023,389,859.52 |
| Basic Necessitites : |
$29,778,465,875,870.61 |
| School Loan Fraud : |
$24,523,442,486,011.09 |
| Tax Evasion + Barter Trade : |
$605,817,137,053,796.00 |
|
|
|
Barren grounds Total Market Statistics ?
| National Currency: |
earth |
| Exchange Rates: |
1 earth = $0.95 |
| |
$1 = 1.05 earths |
| |
Regional Exchange Rates |
| Gross Domestic Product: |
$367,529,000,000,000.00 - 21% |
| Black & Grey Markets Combined: |
$1,408,877,062,915,804.75 - 79% |
| Real Total Economy: |
$1,776,406,062,915,804.75 |
|


