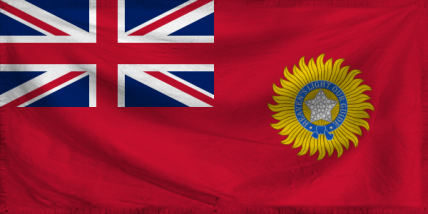
British Indian Empire Domestic Statistics
| Government Category: |
Dominion |
| Government Priority: |
Social Welfare |
| Economic Rating: |
Strong |
| Civil Rights Rating: |
World Benchmark |
| Political Freedoms: |
World Benchmark |
| Income Tax Rate: |
7% |
| Consumer Confidence Rate: |
106% |
| Worker Enthusiasm Rate: |
110% |
| Major Industry: |
Beef-Based Agriculture |
| National Animal: |
elephant |
|
British Indian Empire Demographics
| Total Population: |
6,598,000,000 |
| Criminals: |
706,669,457 |
| Elderly, Disabled, & Retirees: |
951,205,951 |
| Military & Reserves: ? |
202,424,308 |
| Students and Youth: |
1,092,628,800 |
| Unemployed but Able: |
1,036,047,072 |
| Working Class: |
2,609,024,412 |
|
|
|
British Indian Empire Government Budget Details
| Government Budget: |
$15,502,061,101,394.17 |
| Government Expenditures: |
$15,347,040,490,380.22 |
| Goverment Waste: |
$155,020,611,013.94 |
| Goverment Efficiency: |
99% |
|
British Indian Empire Government Spending Breakdown:
| Administration: |
$1,074,292,834,326.62 |
7% |
| Social Welfare: |
$3,376,348,907,883.65 |
22% |
| Healthcare: |
$2,148,585,668,653.23 |
14% |
| Education: |
$2,455,526,478,460.84 |
16% |
| Religion & Spirituality: |
$2,148,585,668,653.23 |
14% |
| Defense: |
$1,841,644,858,845.63 |
12% |
| Law & Order: |
$1,074,292,834,326.62 |
7% |
| Commerce: |
$0.00 |
0% |
| Public Transport: |
$1,074,292,834,326.62 |
7% |
| The Environment: |
$0.00 |
0% |
| Social Equality: |
$306,940,809,807.61 |
2% |
|
|
|
British Indian Empire White Market Statistics ?
| Gross Domestic Product: |
$14,269,800,000,000.00 |
| GDP Per Capita: |
$2,162.75 |
| Average Salary Per Employee: |
$4,145.26 |
| Unemployment Rate: |
23.91% |
| Consumption: |
$71,560,404,161,003.53 |
| Exports: |
$10,248,563,720,192.00 |
| Imports: |
$10,248,563,720,192.00 |
| Trade Net: |
0.00 |
|
British Indian Empire Grey and Black Market Statistics ?
Evasion, Black Market, Barter & Crime
| Black & Grey Markets Combined: |
$8,205,302,178,693.02 |
| Avg Annual Criminal's Income / Savings: ? |
$871.71 |
| Recovered Product + Fines & Fees: |
$430,778,364,381.38 |
|
Black Market & Grey Market Statistics:
| Guns & Weapons: |
$343,439,589,497.22 |
| Drugs and Pharmaceuticals: |
$642,564,393,252.86 |
| Extortion & Blackmail: |
$155,101,750,095.52 |
| Counterfeit Goods: |
$288,046,107,320.25 |
| Trafficking & Intl Sales: |
$310,203,500,191.03 |
| Theft & Disappearance: |
$354,518,285,932.61 |
| Counterfeit Currency & Instruments : |
$443,147,857,415.76 |
| Illegal Mining, Logging, and Hunting : |
$77,550,875,047.76 |
| Basic Necessitites : |
$686,879,178,994.43 |
| School Loan Fraud : |
$354,518,285,932.61 |
| Tax Evasion + Barter Trade : |
$3,528,279,936,838.00 |
|
|
|
British Indian Empire Total Market Statistics ?
| National Currency: |
rupee |
| Exchange Rates: |
1 rupee = $0.23 |
| |
$1 = 4.32 rupees |
| |
Regional Exchange Rates |
| Gross Domestic Product: |
$14,269,800,000,000.00 - 63% |
| Black & Grey Markets Combined: |
$8,205,302,178,693.02 - 37% |
| Real Total Economy: |
$22,475,102,178,693.02 |
|


