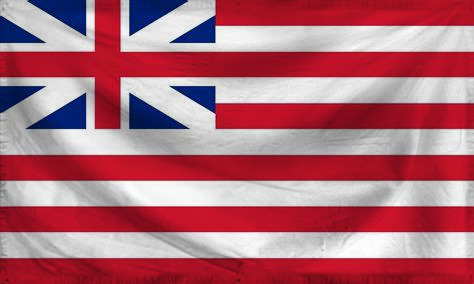
East-India Company Domestic Statistics
| Government Category: |
Dominion |
| Government Priority: |
Law & Order |
| Economic Rating: |
All-Consuming |
| Civil Rights Rating: |
Some |
| Political Freedoms: |
Some |
| Income Tax Rate: |
66% |
| Consumer Confidence Rate: |
101% |
| Worker Enthusiasm Rate: |
101% |
| Major Industry: |
Arms Manufacturing |
| National Animal: |
dove |
|
East-India Company Demographics
| Total Population: |
2,807,000,000 |
| Criminals: |
195,824,137 |
| Elderly, Disabled, & Retirees: |
308,505,591 |
| Military & Reserves: ? |
134,021,535 |
| Students and Youth: |
551,014,100 |
| Unemployed but Able: |
355,598,516 |
| Working Class: |
1,262,036,121 |
|
|
|
East-India Company Government Budget Details
| Government Budget: |
$63,651,916,415,185.71 |
| Government Expenditures: |
$59,832,801,430,274.56 |
| Goverment Waste: |
$3,819,114,984,911.15 |
| Goverment Efficiency: |
94% |
|
East-India Company Government Spending Breakdown:
| Administration: |
$7,179,936,171,632.95 |
12% |
| Social Welfare: |
$1,794,984,042,908.24 |
3% |
| Healthcare: |
$4,786,624,114,421.97 |
8% |
| Education: |
$6,581,608,157,330.20 |
11% |
| Religion & Spirituality: |
$1,196,656,028,605.49 |
2% |
| Defense: |
$9,573,248,228,843.93 |
16% |
| Law & Order: |
$10,769,904,257,449.42 |
18% |
| Commerce: |
$4,786,624,114,421.97 |
8% |
| Public Transport: |
$4,188,296,100,119.22 |
7% |
| The Environment: |
$3,589,968,085,816.47 |
6% |
| Social Equality: |
$3,589,968,085,816.47 |
6% |
|
|
|
East-India Company White Market Statistics ?
| Gross Domestic Product: |
$48,316,200,000,000.00 |
| GDP Per Capita: |
$17,212.75 |
| Average Salary Per Employee: |
$25,385.00 |
| Unemployment Rate: |
11.19% |
| Consumption: |
$29,282,077,706,813.44 |
| Exports: |
$10,881,397,997,568.00 |
| Imports: |
$11,029,681,537,024.00 |
| Trade Net: |
-148,283,539,456.00 |
|
East-India Company Grey and Black Market Statistics ?
Evasion, Black Market, Barter & Crime
| Black & Grey Markets Combined: |
$176,648,548,190,864.91 |
| Avg Annual Criminal's Income / Savings: ? |
$78,305.34 |
| Recovered Product + Fines & Fees: |
$23,847,554,005,766.77 |
|
Black Market & Grey Market Statistics:
| Guns & Weapons: |
$7,185,466,751,554.24 |
| Drugs and Pharmaceuticals: |
$6,314,501,084,699.18 |
| Extortion & Blackmail: |
$8,709,656,668,550.59 |
| Counterfeit Goods: |
$14,806,416,336,536.01 |
| Trafficking & Intl Sales: |
$4,790,311,167,702.83 |
| Theft & Disappearance: |
$6,096,759,667,985.42 |
| Counterfeit Currency & Instruments : |
$16,548,347,670,246.12 |
| Illegal Mining, Logging, and Hunting : |
$4,137,086,917,561.53 |
| Basic Necessitites : |
$5,008,052,584,416.59 |
| School Loan Fraud : |
$6,096,759,667,985.42 |
| Tax Evasion + Barter Trade : |
$75,958,875,722,071.91 |
|
|
|
East-India Company Total Market Statistics ?
| National Currency: |
krona |
| Exchange Rates: |
1 krona = $1.13 |
| |
$1 = 0.88 kronas |
| |
Regional Exchange Rates |
| Gross Domestic Product: |
$48,316,200,000,000.00 - 21% |
| Black & Grey Markets Combined: |
$176,648,548,190,864.91 - 79% |
| Real Total Economy: |
$224,964,748,190,864.91 |
|


