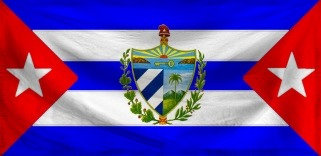
Greater Miami Shores 1 Domestic Statistics
| Government Category: |
Republic |
| Government Priority: |
Religion & Spirituality |
| Economic Rating: |
Very Strong |
| Civil Rights Rating: |
Some |
| Political Freedoms: |
Excellent |
| Income Tax Rate: |
15% |
| Consumer Confidence Rate: |
99% |
| Worker Enthusiasm Rate: |
102% |
| Major Industry: |
Pizza Delivery |
| National Animal: |
El Sinsonte and El Toc |
|
Greater Miami Shores 1 Demographics
| Total Population: |
7,484,000,000 |
| Criminals: |
775,702,071 |
| Elderly, Disabled, & Retirees: |
1,073,690,676 |
| Military & Reserves: ? |
311,781,622 |
| Students and Youth: |
1,236,731,000 |
| Unemployed but Able: |
1,150,151,023 |
| Working Class: |
2,935,943,608 |
|
|
|
Greater Miami Shores 1 Government Budget Details
| Government Budget: |
$30,512,951,943,820.74 |
| Government Expenditures: |
$29,902,692,904,944.32 |
| Goverment Waste: |
$610,259,038,876.41 |
| Goverment Efficiency: |
98% |
|
Greater Miami Shores 1 Government Spending Breakdown:
| Administration: |
$2,093,188,503,346.10 |
7% |
| Social Welfare: |
$0.00 |
0% |
| Healthcare: |
$2,691,242,361,444.99 |
9% |
| Education: |
$2,093,188,503,346.10 |
7% |
| Religion & Spirituality: |
$9,269,834,800,532.74 |
31% |
| Defense: |
$4,784,430,864,791.09 |
16% |
| Law & Order: |
$4,784,430,864,791.09 |
16% |
| Commerce: |
$1,794,161,574,296.66 |
6% |
| Public Transport: |
$2,093,188,503,346.10 |
7% |
| The Environment: |
$299,026,929,049.44 |
1% |
| Social Equality: |
$0.00 |
0% |
|
|
|
Greater Miami Shores 1 White Market Statistics ?
| Gross Domestic Product: |
$26,509,300,000,000.00 |
| GDP Per Capita: |
$3,542.13 |
| Average Salary Per Employee: |
$5,926.51 |
| Unemployment Rate: |
22.51% |
| Consumption: |
$96,412,806,781,337.59 |
| Exports: |
$15,958,594,629,632.00 |
| Imports: |
$15,949,132,464,128.00 |
| Trade Net: |
9,462,165,504.00 |
|
Greater Miami Shores 1 Grey and Black Market Statistics ?
Evasion, Black Market, Barter & Crime
| Black & Grey Markets Combined: |
$51,823,042,495,420.09 |
| Avg Annual Criminal's Income / Savings: ? |
$5,680.95 |
| Recovered Product + Fines & Fees: |
$6,218,765,099,450.41 |
|
Black Market & Grey Market Statistics:
| Guns & Weapons: |
$3,086,839,526,239.70 |
| Drugs and Pharmaceuticals: |
$3,639,221,336,198.38 |
| Extortion & Blackmail: |
$1,689,638,477,520.68 |
| Counterfeit Goods: |
$3,899,165,717,355.41 |
| Trafficking & Intl Sales: |
$2,989,360,383,305.81 |
| Theft & Disappearance: |
$1,169,749,715,206.62 |
| Counterfeit Currency & Instruments : |
$4,029,137,907,933.92 |
| Illegal Mining, Logging, and Hunting : |
$584,874,857,603.31 |
| Basic Necessitites : |
$454,902,667,024.80 |
| School Loan Fraud : |
$974,791,429,338.85 |
| Tax Evasion + Barter Trade : |
$22,283,908,273,030.64 |
|
|
|
Greater Miami Shores 1 Total Market Statistics ?
| National Currency: |
Peso |
| Exchange Rates: |
1 Peso = $0.36 |
| |
$1 = 2.76 Pesos |
| |
Regional Exchange Rates |
| Gross Domestic Product: |
$26,509,300,000,000.00 - 34% |
| Black & Grey Markets Combined: |
$51,823,042,495,420.09 - 66% |
| Real Total Economy: |
$78,332,342,495,420.09 |
|


