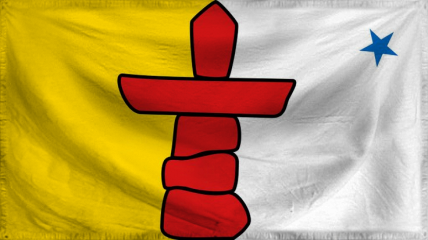
Inuit Confederation Domestic Statistics
| Government Category: |
Nomadic Tribes |
| Government Priority: |
Social Welfare |
| Economic Rating: |
Strong |
| Civil Rights Rating: |
Very Good |
| Political Freedoms: |
Excellent |
| Income Tax Rate: |
26% |
| Consumer Confidence Rate: |
103% |
| Worker Enthusiasm Rate: |
106% |
| Major Industry: |
Trout Farming |
| National Animal: |
Rock Ptarmigan |
|
Inuit Confederation Demographics
| Total Population: |
5,928,000,000 |
| Criminals: |
616,383,267 |
| Elderly, Disabled, & Retirees: |
796,792,987 |
| Military & Reserves: ? |
77,073,349 |
| Students and Youth: |
1,033,250,400 |
| Unemployed but Able: |
912,461,701 |
| Working Class: |
2,492,038,296 |
|
|
|
Inuit Confederation Government Budget Details
| Government Budget: |
$24,728,304,825,223.09 |
| Government Expenditures: |
$24,233,738,728,718.62 |
| Goverment Waste: |
$494,566,096,504.46 |
| Goverment Efficiency: |
98% |
|
Inuit Confederation Government Spending Breakdown:
| Administration: |
$1,938,699,098,297.49 |
8% |
| Social Welfare: |
$4,362,072,971,169.35 |
18% |
| Healthcare: |
$1,938,699,098,297.49 |
8% |
| Education: |
$2,665,711,260,159.05 |
11% |
| Religion & Spirituality: |
$3,392,723,422,020.61 |
14% |
| Defense: |
$1,211,686,936,435.93 |
5% |
| Law & Order: |
$2,665,711,260,159.05 |
11% |
| Commerce: |
$2,908,048,647,446.24 |
12% |
| Public Transport: |
$1,454,024,323,723.12 |
6% |
| The Environment: |
$727,012,161,861.56 |
3% |
| Social Equality: |
$727,012,161,861.56 |
3% |
|
|
|
Inuit Confederation White Market Statistics ?
| Gross Domestic Product: |
$20,394,600,000,000.00 |
| GDP Per Capita: |
$3,440.38 |
| Average Salary Per Employee: |
$5,807.87 |
| Unemployment Rate: |
22.61% |
| Consumption: |
$47,939,392,655,851.52 |
| Exports: |
$8,288,645,283,840.00 |
| Imports: |
$8,759,063,609,344.00 |
| Trade Net: |
-470,418,325,504.00 |
|
Inuit Confederation Grey and Black Market Statistics ?
Evasion, Black Market, Barter & Crime
| Black & Grey Markets Combined: |
$25,913,074,178,374.59 |
| Avg Annual Criminal's Income / Savings: ? |
$3,073.14 |
| Recovered Product + Fines & Fees: |
$2,137,828,619,715.90 |
|
Black Market & Grey Market Statistics:
| Guns & Weapons: |
$575,955,323,658.51 |
| Drugs and Pharmaceuticals: |
$1,389,068,721,764.63 |
| Extortion & Blackmail: |
$1,355,188,996,843.55 |
| Counterfeit Goods: |
$1,727,865,970,975.52 |
| Trafficking & Intl Sales: |
$982,512,022,711.57 |
| Theft & Disappearance: |
$745,353,948,263.95 |
| Counterfeit Currency & Instruments : |
$1,456,828,171,606.81 |
| Illegal Mining, Logging, and Hunting : |
$406,556,699,053.06 |
| Basic Necessitites : |
$1,693,986,246,054.43 |
| School Loan Fraud : |
$846,993,123,027.22 |
| Tax Evasion + Barter Trade : |
$11,142,621,896,701.07 |
|
|
|
Inuit Confederation Total Market Statistics ?
| National Currency: |
Fishcoin |
| Exchange Rates: |
1 Fishcoin = $0.29 |
| |
$1 = 3.43 Fishcoins |
| |
Regional Exchange Rates |
| Gross Domestic Product: |
$20,394,600,000,000.00 - 44% |
| Black & Grey Markets Combined: |
$25,913,074,178,374.59 - 56% |
| Real Total Economy: |
$46,307,674,178,374.59 |
|


