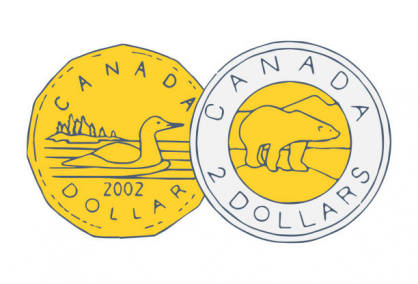
Loonies and Toonies Domestic Statistics
| Government Category: |
Canadian Currency |
| Government Priority: |
Defence |
| Economic Rating: |
Good |
| Civil Rights Rating: |
Some |
| Political Freedoms: |
Few |
| Income Tax Rate: |
58% |
| Consumer Confidence Rate: |
98% |
| Worker Enthusiasm Rate: |
98% |
| Major Industry: |
Arms Manufacturing |
| National Animal: |
beaver |
|
Loonies and Toonies Demographics
| Total Population: |
6,077,000,000 |
| Criminals: |
673,138,709 |
| Elderly, Disabled, & Retirees: |
703,898,705 |
| Military & Reserves: ? |
331,833,559 |
| Students and Youth: |
1,130,929,700 |
| Unemployed but Able: |
935,433,209 |
| Working Class: |
2,301,766,117 |
|
|
|
Loonies and Toonies Government Budget Details
| Government Budget: |
$28,359,534,888,511.08 |
| Government Expenditures: |
$26,090,772,097,430.19 |
| Goverment Waste: |
$2,268,762,791,080.89 |
| Goverment Efficiency: |
92% |
|
Loonies and Toonies Government Spending Breakdown:
| Administration: |
$3,391,800,372,665.93 |
13% |
| Social Welfare: |
$2,087,261,767,794.42 |
8% |
| Healthcare: |
$2,087,261,767,794.42 |
8% |
| Education: |
$2,348,169,488,768.72 |
9% |
| Religion & Spirituality: |
$1,043,630,883,897.21 |
4% |
| Defense: |
$5,479,062,140,460.34 |
21% |
| Law & Order: |
$3,913,615,814,614.53 |
15% |
| Commerce: |
$1,304,538,604,871.51 |
5% |
| Public Transport: |
$1,304,538,604,871.51 |
5% |
| The Environment: |
$1,565,446,325,845.81 |
6% |
| Social Equality: |
$1,304,538,604,871.51 |
5% |
|
|
|
Loonies and Toonies White Market Statistics ?
| Gross Domestic Product: |
$20,891,800,000,000.00 |
| GDP Per Capita: |
$3,437.85 |
| Average Salary Per Employee: |
$5,666.05 |
| Unemployment Rate: |
22.61% |
| Consumption: |
$18,429,529,093,570.56 |
| Exports: |
$5,569,942,609,920.00 |
| Imports: |
$5,678,893,629,440.00 |
| Trade Net: |
-108,951,019,520.00 |
|
Loonies and Toonies Grey and Black Market Statistics ?
Evasion, Black Market, Barter & Crime
| Black & Grey Markets Combined: |
$81,800,956,796,072.89 |
| Avg Annual Criminal's Income / Savings: ? |
$10,773.20 |
| Recovered Product + Fines & Fees: |
$9,202,607,639,558.20 |
|
Black Market & Grey Market Statistics:
| Guns & Weapons: |
$4,551,916,492,113.47 |
| Drugs and Pharmaceuticals: |
$3,000,126,778,892.97 |
| Extortion & Blackmail: |
$3,724,295,311,729.20 |
| Counterfeit Goods: |
$6,310,611,500,430.04 |
| Trafficking & Intl Sales: |
$2,069,052,950,960.67 |
| Theft & Disappearance: |
$2,689,768,836,248.87 |
| Counterfeit Currency & Instruments : |
$7,965,853,861,198.57 |
| Illegal Mining, Logging, and Hunting : |
$1,758,695,008,316.57 |
| Basic Necessitites : |
$3,103,579,426,441.00 |
| School Loan Fraud : |
$2,482,863,541,152.80 |
| Tax Evasion + Barter Trade : |
$35,174,411,422,311.34 |
|
|
|
Loonies and Toonies Total Market Statistics ?
| National Currency: |
loonie AND toonie |
| Exchange Rates: |
1 loonie AND toonie = $0.25 |
| |
$1 = 3.96 loonie AND toonies |
| |
Regional Exchange Rates |
| Gross Domestic Product: |
$20,891,800,000,000.00 - 20% |
| Black & Grey Markets Combined: |
$81,800,956,796,072.89 - 80% |
| Real Total Economy: |
$102,692,756,796,072.89 |
|


