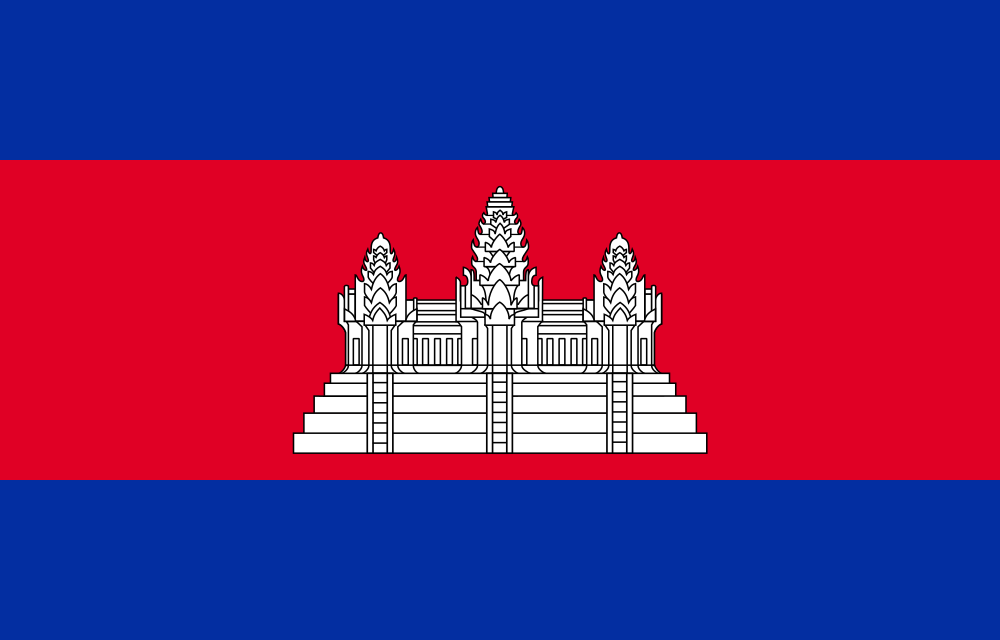
Maha Yantra Domestic Statistics
| Government Category: |
Armed Republic |
| Government Priority: |
Education |
| Economic Rating: |
Good |
| Civil Rights Rating: |
Very Good |
| Political Freedoms: |
Excellent |
| Income Tax Rate: |
53% |
| Consumer Confidence Rate: |
102% |
| Worker Enthusiasm Rate: |
105% |
| Major Industry: |
Door-to-door Insurance Sales |
| National Animal: |
Three headed Lion |
|
Maha Yantra Demographics
| Total Population: |
322,000,000 |
| Criminals: |
32,720,747 |
| Elderly, Disabled, & Retirees: |
31,679,496 |
| Military & Reserves: ? |
7,606,565 |
| Students and Youth: |
67,732,700 |
| Unemployed but Able: |
49,004,749 |
| Working Class: |
133,255,743 |
|
|
|
Maha Yantra Government Budget Details
| Government Budget: |
$1,671,985,691,778.09 |
| Government Expenditures: |
$1,638,545,977,942.53 |
| Goverment Waste: |
$33,439,713,835.56 |
| Goverment Efficiency: |
98% |
|
Maha Yantra Government Spending Breakdown:
| Administration: |
$262,167,356,470.80 |
16% |
| Social Welfare: |
$163,854,597,794.25 |
10% |
| Healthcare: |
$163,854,597,794.25 |
10% |
| Education: |
$311,323,735,809.08 |
19% |
| Religion & Spirituality: |
$65,541,839,117.70 |
4% |
| Defense: |
$147,469,138,014.83 |
9% |
| Law & Order: |
$114,698,218,455.98 |
7% |
| Commerce: |
$114,698,218,455.98 |
7% |
| Public Transport: |
$81,927,298,897.13 |
5% |
| The Environment: |
$98,312,758,676.55 |
6% |
| Social Equality: |
$81,927,298,897.13 |
5% |
|
|
|
Maha Yantra White Market Statistics ?
| Gross Domestic Product: |
$1,343,910,000,000.00 |
| GDP Per Capita: |
$4,173.63 |
| Average Salary Per Employee: |
$7,020.81 |
| Unemployment Rate: |
21.88% |
| Consumption: |
$1,218,185,626,910.72 |
| Exports: |
$330,213,457,920.00 |
| Imports: |
$350,106,419,200.00 |
| Trade Net: |
-19,892,961,280.00 |
|
Maha Yantra Grey and Black Market Statistics ?
Evasion, Black Market, Barter & Crime
| Black & Grey Markets Combined: |
$2,111,371,101,560.97 |
| Avg Annual Criminal's Income / Savings: ? |
$4,716.88 |
| Recovered Product + Fines & Fees: |
$110,846,982,831.95 |
|
Black Market & Grey Market Statistics:
| Guns & Weapons: |
$57,014,937,383.78 |
| Drugs and Pharmaceuticals: |
$122,582,115,375.12 |
| Extortion & Blackmail: |
$131,134,355,982.69 |
| Counterfeit Goods: |
$105,477,634,159.99 |
| Trafficking & Intl Sales: |
$57,014,937,383.78 |
| Theft & Disappearance: |
$85,522,406,075.67 |
| Counterfeit Currency & Instruments : |
$156,791,077,805.39 |
| Illegal Mining, Logging, and Hunting : |
$48,462,696,776.21 |
| Basic Necessitites : |
$125,432,862,244.31 |
| School Loan Fraud : |
$125,432,862,244.31 |
| Tax Evasion + Barter Trade : |
$907,889,573,671.22 |
|
|
|
Maha Yantra Total Market Statistics ?
| National Currency: |
Ops |
| Exchange Rates: |
1 Ops = $0.28 |
| |
$1 = 3.59 Opss |
| |
Regional Exchange Rates |
| Gross Domestic Product: |
$1,343,910,000,000.00 - 39% |
| Black & Grey Markets Combined: |
$2,111,371,101,560.97 - 61% |
| Real Total Economy: |
$3,455,281,101,560.97 |
|