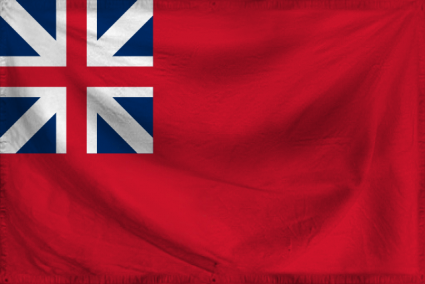
Massachusetts Bay Domestic Statistics
| Government Category: |
Colony |
| Government Priority: |
Social Welfare |
| Economic Rating: |
Good |
| Civil Rights Rating: |
Very Good |
| Political Freedoms: |
Superb |
| Income Tax Rate: |
14% |
| Consumer Confidence Rate: |
102% |
| Worker Enthusiasm Rate: |
105% |
| Major Industry: |
Beef-Based Agriculture |
| National Animal: |
eagle |
|
Massachusetts Bay Demographics
| Total Population: |
4,665,000,000 |
| Criminals: |
511,063,369 |
| Elderly, Disabled, & Retirees: |
644,518,316 |
| Military & Reserves: ? |
166,056,806 |
| Students and Youth: |
795,382,500 |
| Unemployed but Able: |
737,169,076 |
| Working Class: |
1,810,809,934 |
|
|
|
Massachusetts Bay Government Budget Details
| Government Budget: |
$9,856,354,156,397.20 |
| Government Expenditures: |
$9,659,227,073,269.26 |
| Goverment Waste: |
$197,127,083,127.94 |
| Goverment Efficiency: |
98% |
|
Massachusetts Bay Government Spending Breakdown:
| Administration: |
$772,738,165,861.54 |
8% |
| Social Welfare: |
$2,028,437,685,386.54 |
21% |
| Healthcare: |
$1,352,291,790,257.70 |
14% |
| Education: |
$1,448,884,060,990.39 |
15% |
| Religion & Spirituality: |
$0.00 |
0% |
| Defense: |
$1,352,291,790,257.70 |
14% |
| Law & Order: |
$1,255,699,519,525.00 |
13% |
| Commerce: |
$96,592,270,732.69 |
1% |
| Public Transport: |
$772,738,165,861.54 |
8% |
| The Environment: |
$96,592,270,732.69 |
1% |
| Social Equality: |
$386,369,082,930.77 |
4% |
|
|
|
Massachusetts Bay White Market Statistics ?
| Gross Domestic Product: |
$8,211,660,000,000.00 |
| GDP Per Capita: |
$1,760.27 |
| Average Salary Per Employee: |
$3,156.90 |
| Unemployment Rate: |
24.33% |
| Consumption: |
$32,244,002,413,608.96 |
| Exports: |
$4,737,498,382,336.00 |
| Imports: |
$5,135,265,693,696.00 |
| Trade Net: |
-397,767,311,360.00 |
|
Massachusetts Bay Grey and Black Market Statistics ?
Evasion, Black Market, Barter & Crime
| Black & Grey Markets Combined: |
$8,085,925,334,927.57 |
| Avg Annual Criminal's Income / Savings: ? |
$1,280.08 |
| Recovered Product + Fines & Fees: |
$788,377,720,155.44 |
|
Black Market & Grey Market Statistics:
| Guns & Weapons: |
$291,172,149,829.41 |
| Drugs and Pharmaceuticals: |
$447,157,230,095.16 |
| Extortion & Blackmail: |
$187,182,096,318.91 |
| Counterfeit Goods: |
$436,758,224,744.11 |
| Trafficking & Intl Sales: |
$176,783,090,967.86 |
| Theft & Disappearance: |
$374,364,192,637.81 |
| Counterfeit Currency & Instruments : |
$582,344,299,658.82 |
| Illegal Mining, Logging, and Hunting : |
$103,990,053,510.50 |
| Basic Necessitites : |
$634,339,326,414.07 |
| School Loan Fraud : |
$322,369,165,882.56 |
| Tax Evasion + Barter Trade : |
$3,476,947,894,018.86 |
|
|
|
Massachusetts Bay Total Market Statistics ?
| National Currency: |
dollar |
| Exchange Rates: |
1 dollar = $0.18 |
| |
$1 = 5.53 dollars |
| |
Regional Exchange Rates |
| Gross Domestic Product: |
$8,211,660,000,000.00 - 50% |
| Black & Grey Markets Combined: |
$8,085,925,334,927.57 - 50% |
| Real Total Economy: |
$16,297,585,334,927.57 |
|


