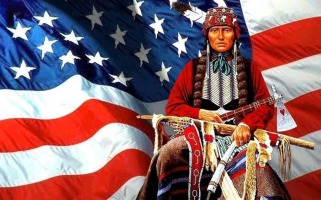
Native Tribal Nations Domestic Statistics
| Government Category: |
Dominion |
| Government Priority: |
Law & Order |
| Economic Rating: |
Fragile |
| Civil Rights Rating: |
Rare |
| Political Freedoms: |
Excellent |
| Income Tax Rate: |
72% |
| Consumer Confidence Rate: |
91% |
| Worker Enthusiasm Rate: |
95% |
| Major Industry: |
Arms Manufacturing |
| National Animal: |
Buffalo |
|
Native Tribal Nations Demographics
| Total Population: |
32,079,000,000 |
| Criminals: |
3,646,998,700 |
| Elderly, Disabled, & Retirees: |
3,843,779,828 |
| Military & Reserves: ? |
801,902,384 |
| Students and Youth: |
6,056,515,200 |
| Unemployed but Able: |
5,166,666,544 |
| Working Class: |
12,563,137,345 |
|
|
|
Native Tribal Nations Government Budget Details
| Government Budget: |
$22,753,407,987,131.35 |
| Government Expenditures: |
$22,298,339,827,388.72 |
| Goverment Waste: |
$455,068,159,742.63 |
| Goverment Efficiency: |
98% |
|
Native Tribal Nations Government Spending Breakdown:
| Administration: |
$1,783,867,186,191.10 |
8% |
| Social Welfare: |
$1,114,916,991,369.44 |
5% |
| Healthcare: |
$1,783,867,186,191.10 |
8% |
| Education: |
$1,783,867,186,191.10 |
8% |
| Religion & Spirituality: |
$1,560,883,787,917.21 |
7% |
| Defense: |
$2,229,833,982,738.87 |
10% |
| Law & Order: |
$2,675,800,779,286.65 |
12% |
| Commerce: |
$1,783,867,186,191.10 |
8% |
| Public Transport: |
$1,783,867,186,191.10 |
8% |
| The Environment: |
$1,783,867,186,191.10 |
8% |
| Social Equality: |
$1,783,867,186,191.10 |
8% |
|
|
|
Native Tribal Nations White Market Statistics ?
| Gross Domestic Product: |
$17,846,800,000,000.00 |
| GDP Per Capita: |
$556.34 |
| Average Salary Per Employee: |
$798.25 |
| Unemployment Rate: |
25.60% |
| Consumption: |
$7,787,928,973,475.84 |
| Exports: |
$3,686,687,932,416.00 |
| Imports: |
$4,132,986,159,104.00 |
| Trade Net: |
-446,298,226,688.00 |
|
Native Tribal Nations Grey and Black Market Statistics ?
Evasion, Black Market, Barter & Crime
| Black & Grey Markets Combined: |
$63,918,070,861,105.09 |
| Avg Annual Criminal's Income / Savings: ? |
$1,352.33 |
| Recovered Product + Fines & Fees: |
$5,752,626,377,499.46 |
|
Black Market & Grey Market Statistics:
| Guns & Weapons: |
$1,947,815,322,144.74 |
| Drugs and Pharmaceuticals: |
$2,569,458,510,063.28 |
| Extortion & Blackmail: |
$2,652,344,268,452.42 |
| Counterfeit Goods: |
$4,144,287,919,456.90 |
| Trafficking & Intl Sales: |
$2,569,458,510,063.28 |
| Theft & Disappearance: |
$2,652,344,268,452.42 |
| Counterfeit Currency & Instruments : |
$4,144,287,919,456.90 |
| Illegal Mining, Logging, and Hunting : |
$1,989,258,201,339.31 |
| Basic Necessitites : |
$2,155,029,718,117.59 |
| School Loan Fraud : |
$1,989,258,201,339.31 |
| Tax Evasion + Barter Trade : |
$27,484,770,470,275.19 |
|
|
|
Native Tribal Nations Total Market Statistics ?
| National Currency: |
wampum |
| Exchange Rates: |
1 wampum = $0.04 |
| |
$1 = 26.95 wampums |
| |
Regional Exchange Rates |
| Gross Domestic Product: |
$17,846,800,000,000.00 - 22% |
| Black & Grey Markets Combined: |
$63,918,070,861,105.09 - 78% |
| Real Total Economy: |
$81,764,870,861,105.09 |
|


